Chapter 6 Demographic Effects on Vocabulary Size
Chapter 5 examined cross-linguistic consistency and variability in the size of children’s reported vocabulary. In this chapter, we follow up these analyses by beginning the process – which continues throughout the book – of attempting to understand the nature and sources of these differences. In particular, we take advantage of the sample diversity described in Chapter 3 to explore differences in the median trajectory of vocabulary growth across demographic characteristics, focusing on three variables that are available in much of our data: sex, maternal education, and birth order.
While some demographic differences in vocabulary are quite consistent – substantially so, as it turns out – the overall proportion of variance in vocabulary that they capture is still relatively limited, as noted by previous analysts of variability (e.g., Fenson et al. 1994; Feldman et al. 2000; Eriksson et al. 2012). We will examine a number of different perspectives on how to quantify this relationship, moving back and forth between emphasizing consistency in differences in the central tendency and emphasizing the limited size of these effects relative to the variability documented in Chapter 5.
Our analyses in this chapter are limited to a subset of languages, as demographic data for many contributed datasets were not available. We begin with sex, the variable for which the most analysis has already been done and for which we have the most data, then move on to birth order, and finally, turn to maternal education. Throughout, we focus on earlier comprehension differences from Words & Gestures-type forms and later production differences from Words & Sentences-type forms. For the sake of length, we omit analysis of production data from WG-type forms. As discussed in the previous chapter, these data tend to show limited variability due to floor effects.
6.1 Sex
Our first analysis examines how vocabulary development differs by children’s sex.13 The literature on cognitive differences due to sex is vast, controversial in many places, and difficult to summarize (see Miller and Halpern 2014 for a useful recent review). Focusing on development, Maccoby and Jacklin (1974) began the enterprise of systematizing and summarizing gender differences. Their conclusions were largely deflationary but did suggest some differences in aggression and verbal ability (which were suggested to emerge in the period of early adolescence). The claim about verbal ability is most relevant for our analysis, but has been controversial as well.
Using meta-analytic tools, Hyde and Linn (1988) found that differences in verbal ability were minimal, but more recent studies have suggested consistent verbal ability differences. For example, Stoet and Geary (2013) found differences in reading ability across nations in a massive elementary education dataset (the PISA assessment), with variance in the magnitude of difference, but with girls very consistently showing an advantage. Similarly, Robinson and Lubienski (2011) reported consistent differences in reading ability (favoring girls) at the onset of kindergarten in a nationally-representative US sample. A potential prediction from this literature is thus that we might observe a modest but consistent female advantage in early vocabulary.
Of course, a complication of our analysis is the potential presence of caregiver reporting bias added to any true sex differences. In contrast to these findings suggesting modest and consistent female advantages, there is substantial cross-linguistic variation in gender stereotypes (Nosek et al. 2009). Thus, a second plausible speculation is that, if stereotype-based reporting bias plays a major role in gender effects, the cross-national variance should be high and correlated with gender stereotypes.
Despite these predictions, it almost goes without saying that any finding from our analyses here is subject to the full range of possible explanations articulated in the literature. These range from caregiver and academic socialization (e.g., self-fulfilling expectations that girls are more verbal) to “self socialization” in which affiliative differences produce differences in behavior, all the way to biological explanations.14 While descriptive data of the type cited above (and reported in our analyses below) can be more or less consistent with some of these theories, conclusive evidence will not be forthcoming.
Our analyses below replicate and extend the results of Eriksson et al. (2012), who used an overlapping sample of CDI data from 12 languages to explore sex effects on vocabulary size.15
6.1.1 Comprehension (WG)
We begin by examining data from WG-type forms using comprehension measures. Figure 6.1 shows our approach. Each subplot shows median reported comprehension for each age and sex group. Smoothing lines show the predictions of a robust generalized linear model (we selected a robust GLM to avoid some pathological effects from outliers in a small subset of situations).
Visual inspection of the data suggest limited sex differences, but a female advantage is present in some languages (most pronounced in Korean, Latvian, and Hebrew). Note that many authors do not find gender differences in early comprehension. For example, using an overlapping 12 language dataset, Eriksson et al. (2012) concluded that there were no major comprehension differences. And in an earlier study, Feldman et al. (2000) also did not find gender differences in comprehension using a large, relatively representative American dataset, though this study included data only from younger children (10–13 months).
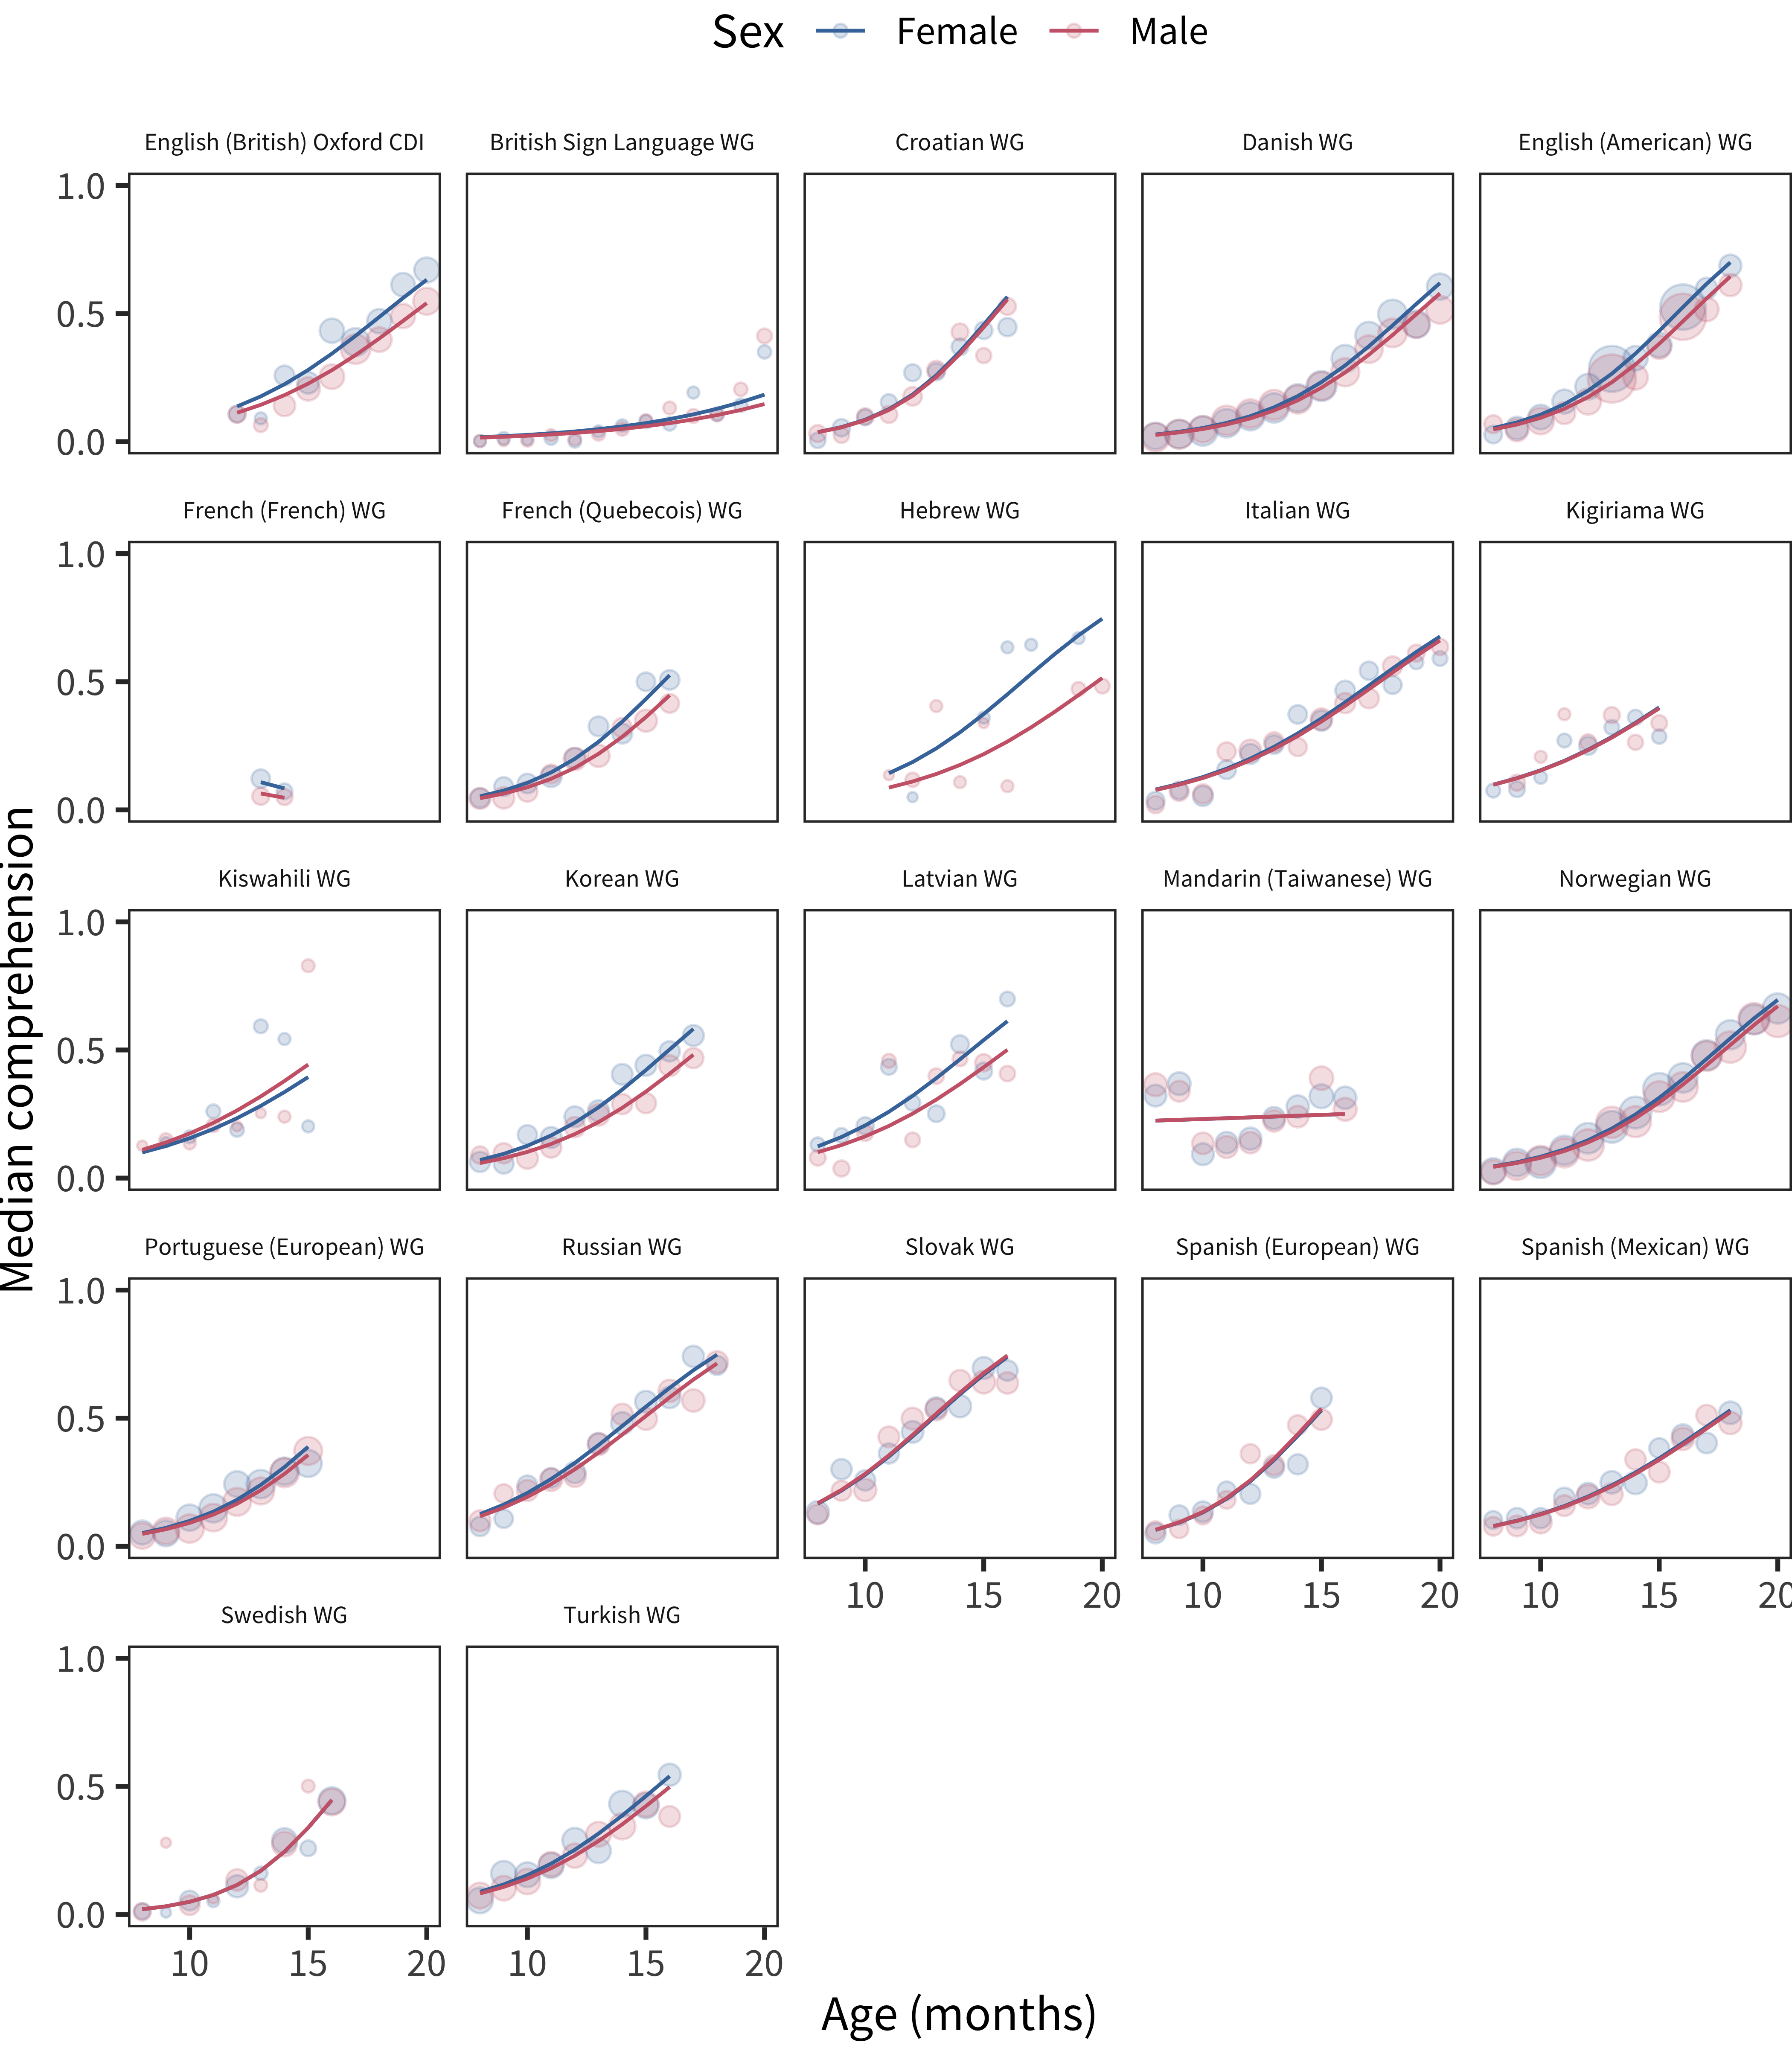
Figure 6.1: Differences in WG comprehension scores by sex, plotted across age by language.
We can examine statistical models to get a clearer picture. For each language, we fit a robust generalized linear model predicting vocabulary size (number of words understood out of the total) based on age and the interaction of age and sex. We specified this simple model so that the coefficient estimate for the age by sex interaction (as shown in Figure 6.2) provides a convenient summary of the difference in vocabulary growth across groups. Despite the small magnitudes of the coefficients, 16 of 22 languages had a female advantage. In contrast, only 2 showed a male advantage and the remainder did not show a significant sex by age interaction.
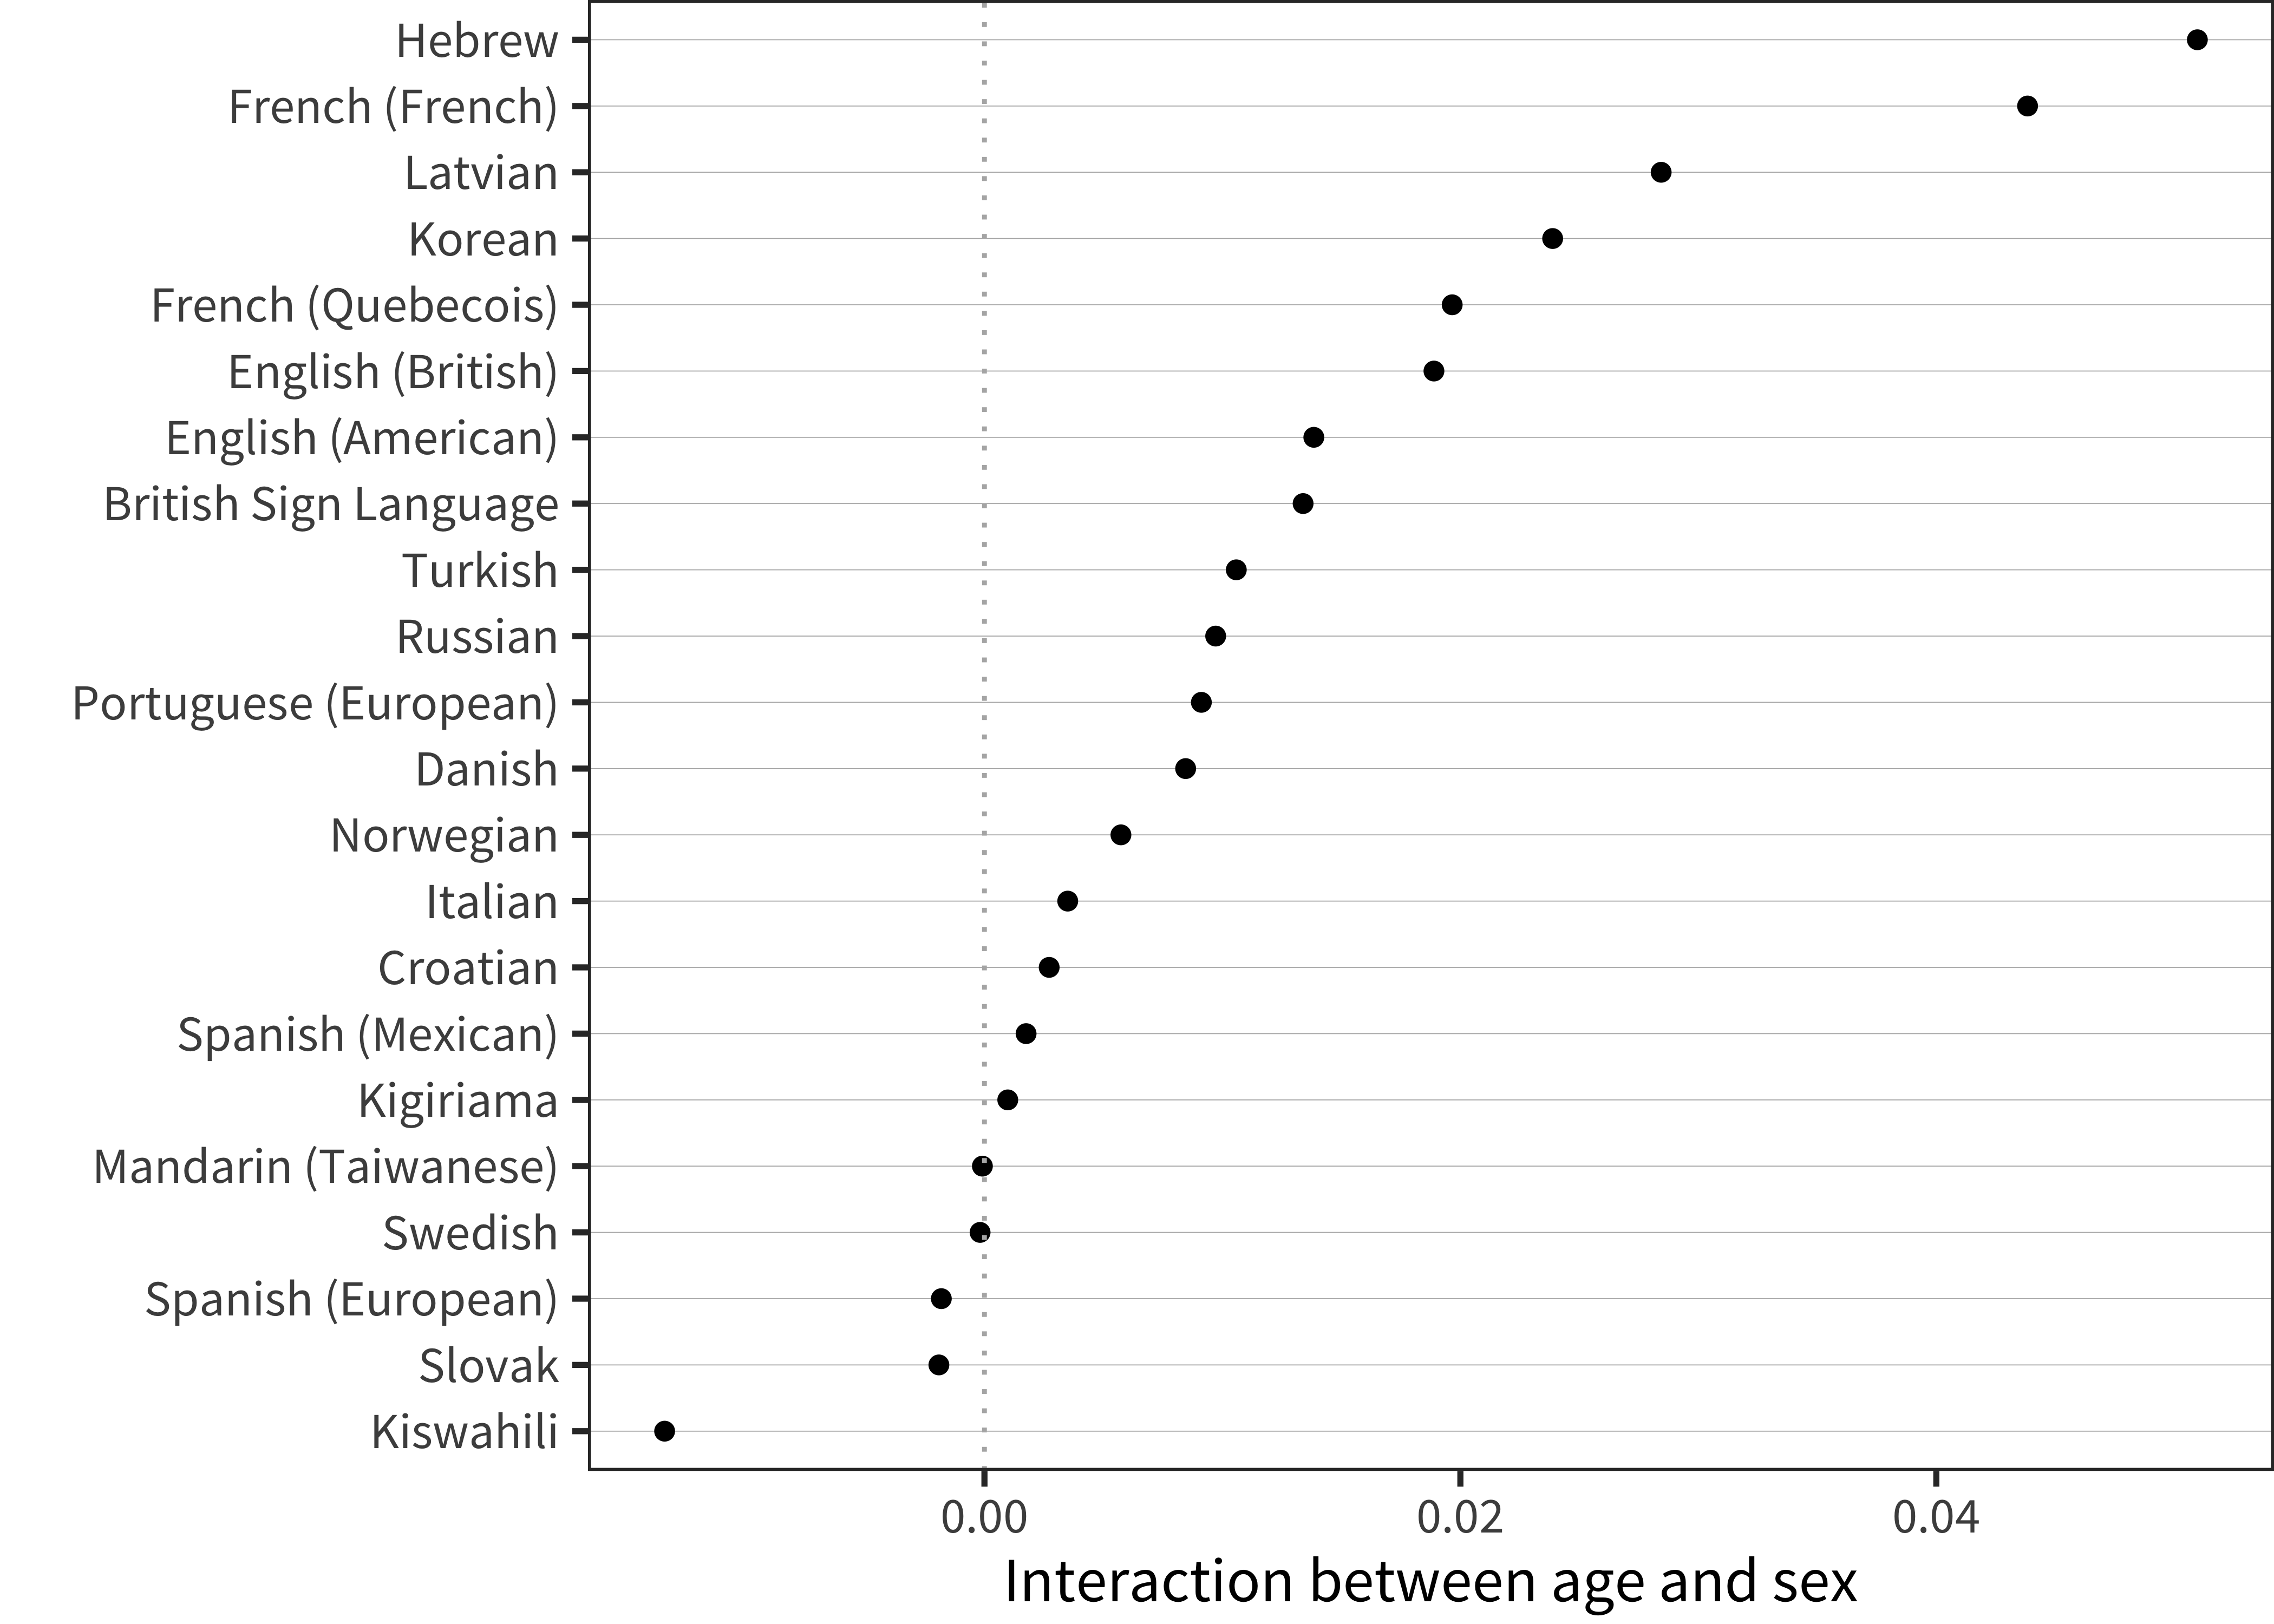
Figure 6.2: Interaction term between age and sex for WG comprehension data in each language.
As a contrast to the model-based method above, we can look for a measure of effect size (similar to that used in the previous chapter). Effect size quantifies the size of the difference between groups in terms of the variability, producing a scale-free measure of difference that is appropriate for comparison across languages. Normally we would use a measure like Cohen’s d here, where \(mu_1\) and \(mu_2\) index the means for each group and \(\sigma_{pooled}\) indicates the pooled standard deviation across groups:
\[d = \frac{\mu_2 - \mu_1}{\sigma_{pooled}}\]
But, as in the previous chapter, we have the problem of non-normal distributions. To circumvent this issue, we use a non-parametric measure derived from the same components: the difference between medians, divided by the MAD. (We call this the MMAD; Appendix B shows that it is comparable to Cohen’s \(d\) as a measure of effect size).
Applying this measure to the data on comprehension, we see a quite small average female advantage that appears relatively constant across age (Figure 6.3). For those languages with dense enough data, we can take a weighted average of this pattern across ages, which reveals substantial variability (Figure 6.4). The overall median for these 18 languages is quite small as well, 0.08. In summary, there is some evidence for a modest female advantage in comprehension.
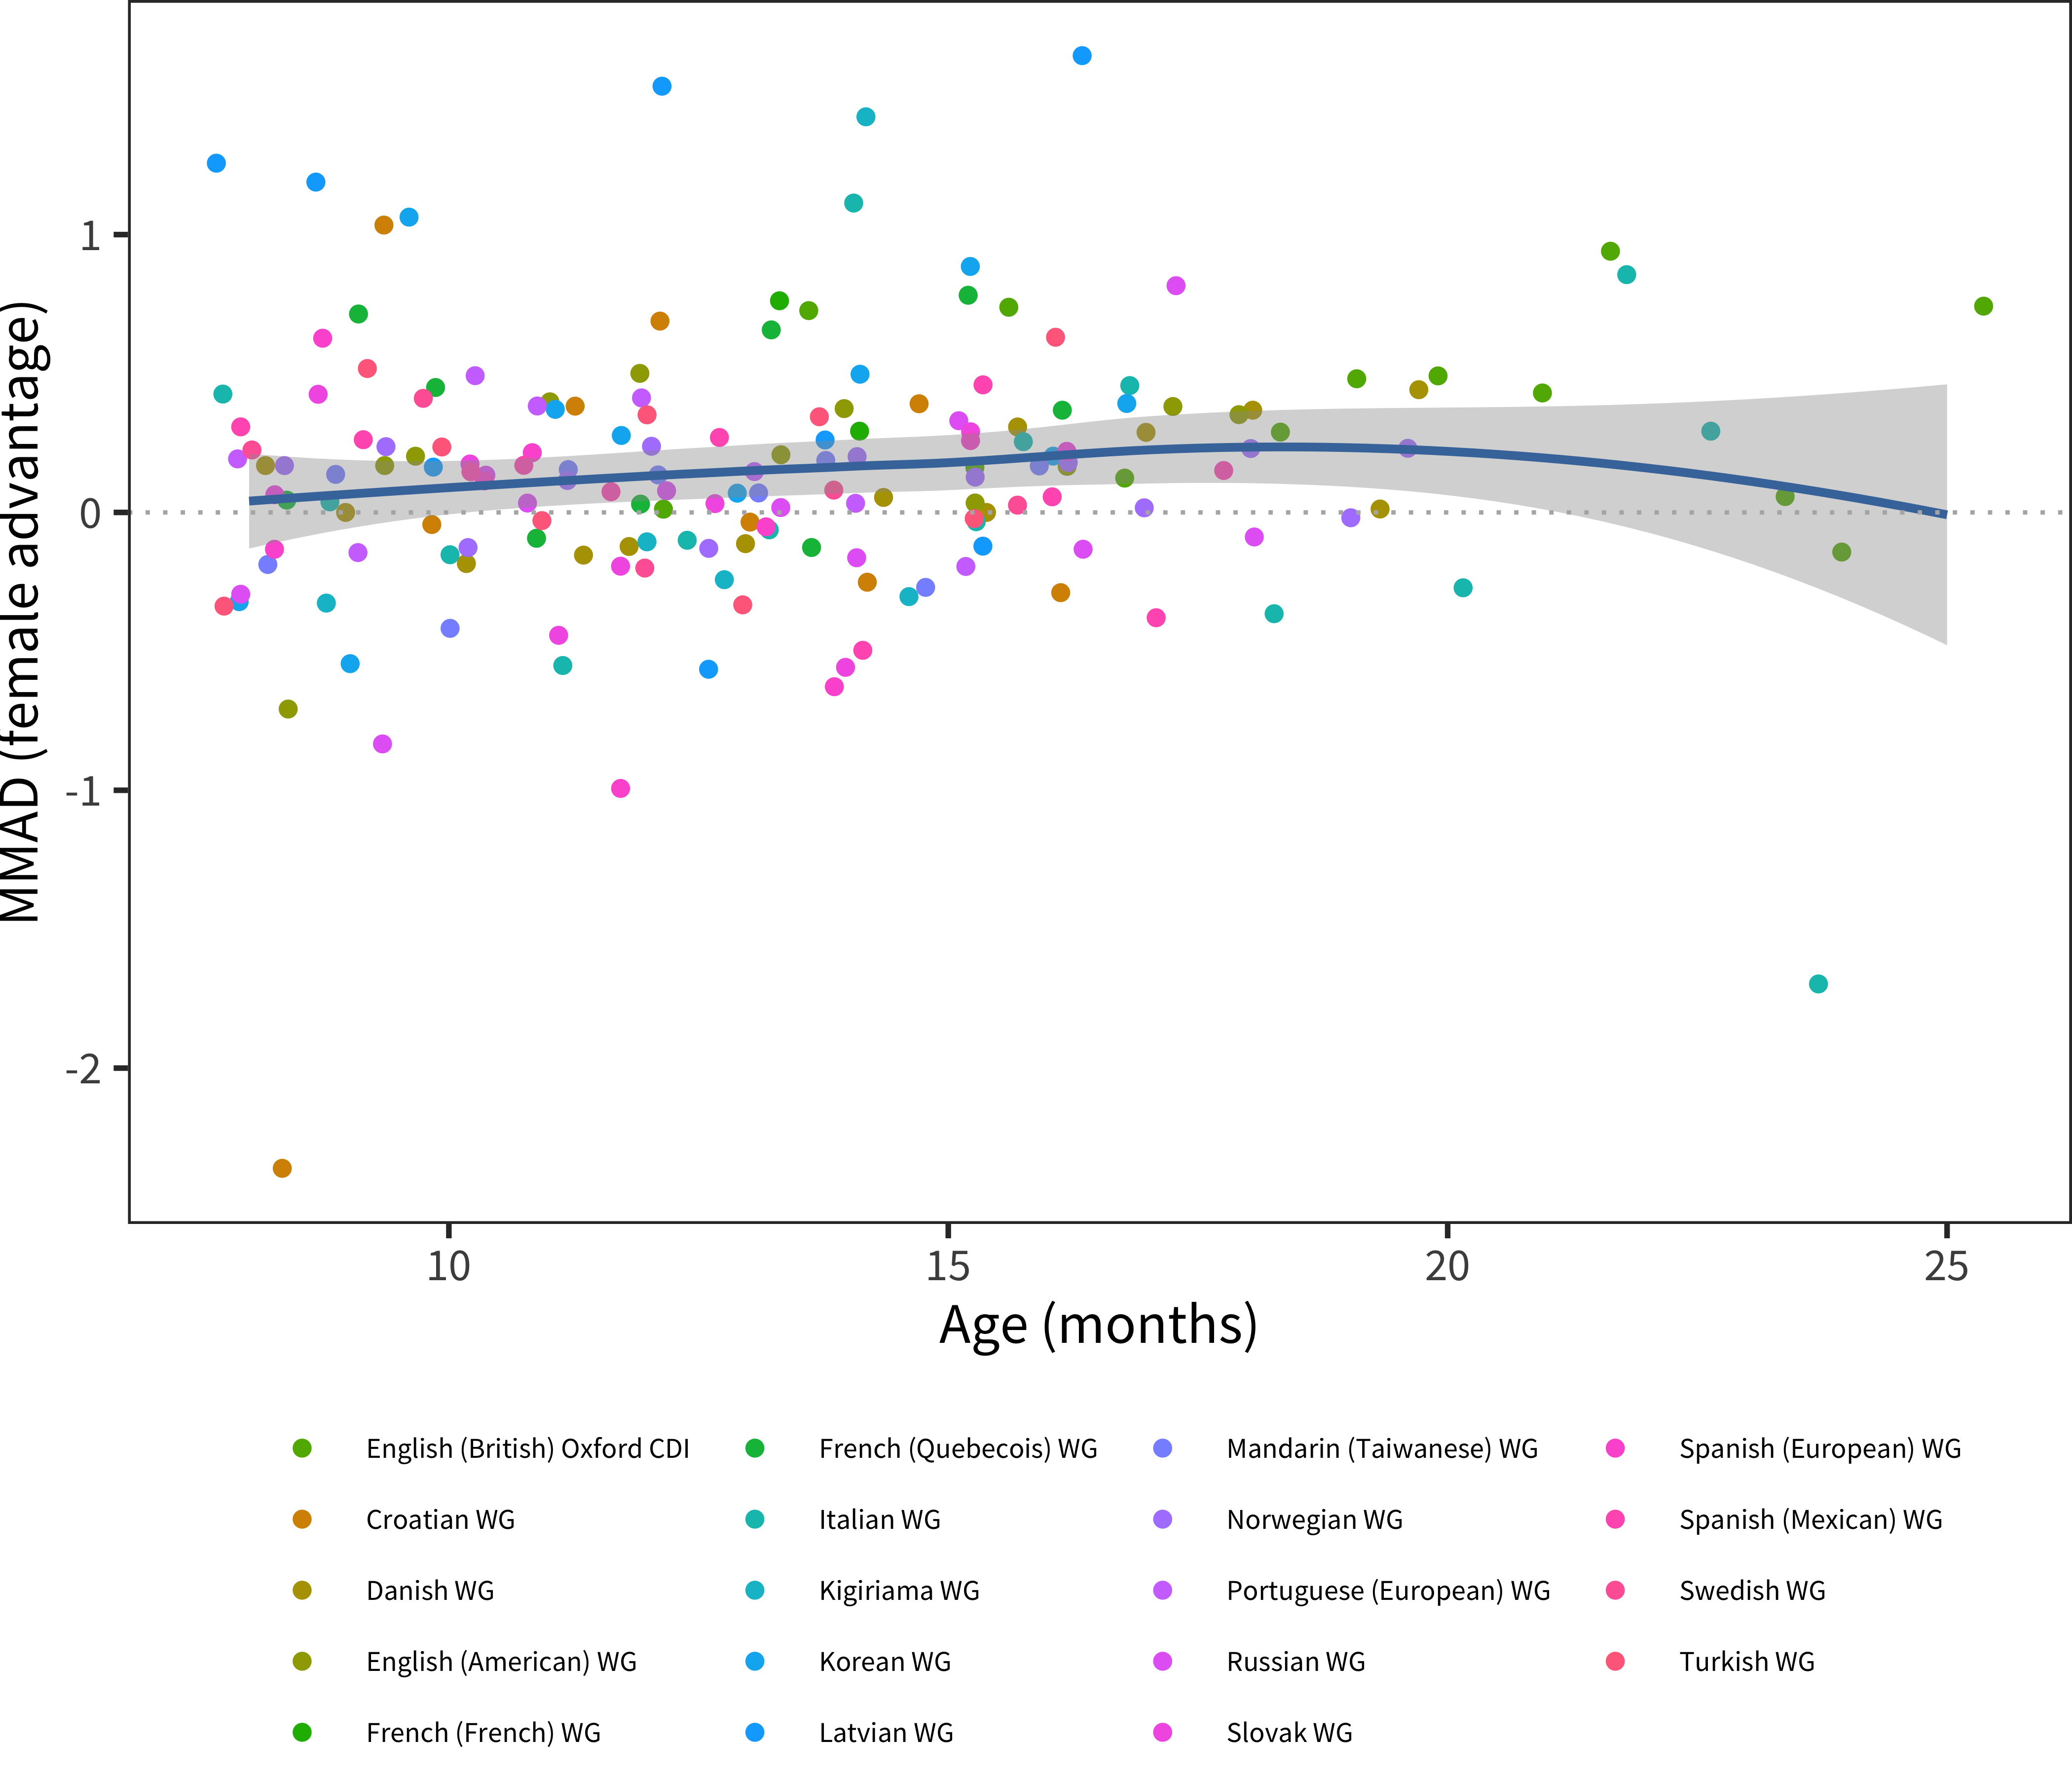
Figure 6.3: MMAD female advantage for WG comprehension data in each language across age.
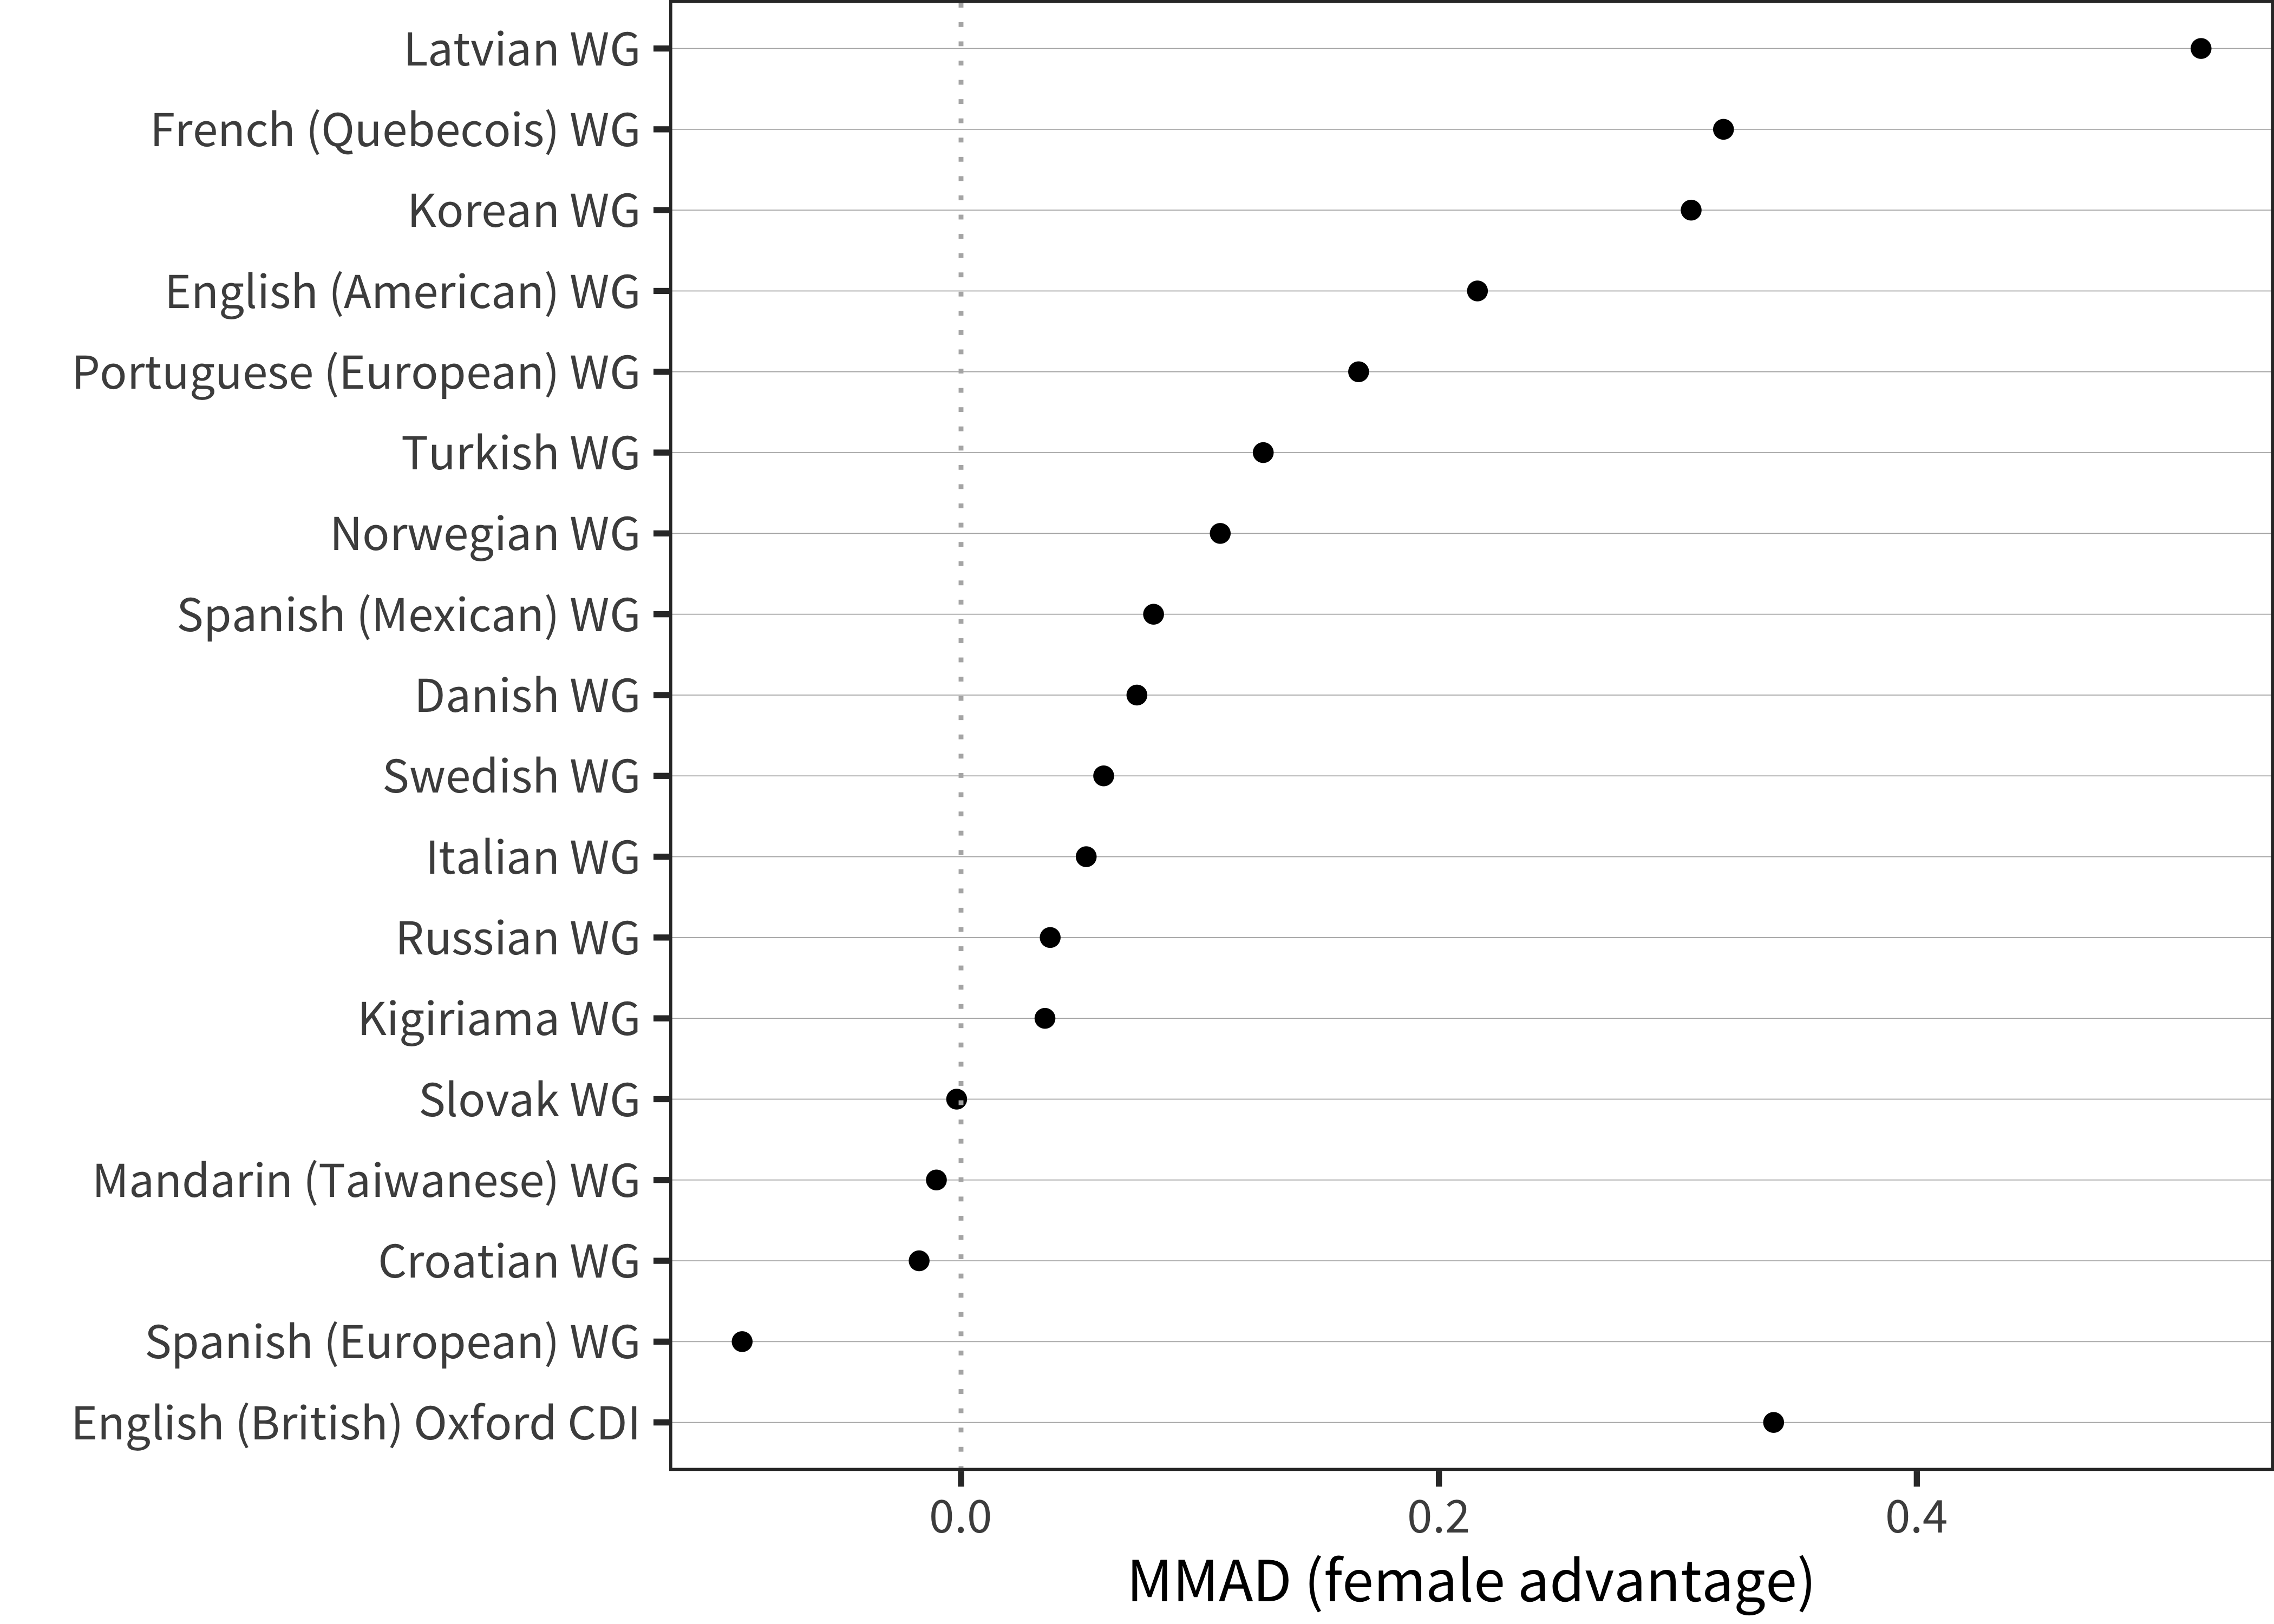
Figure 6.4: MMAD female advantage for WG comprehension data in each language averaged over age.
6.1.2 Production (WS)
We next turn to production data on the Words & Sentences instrument. Figure 6.5 shows curves for each individual language. Visual inspection confirms a female advantage in almost every case, and an analysis of the fitted models (see Figure 6.6) shows that 25 of 26 languages show a statistically significant female advantage!
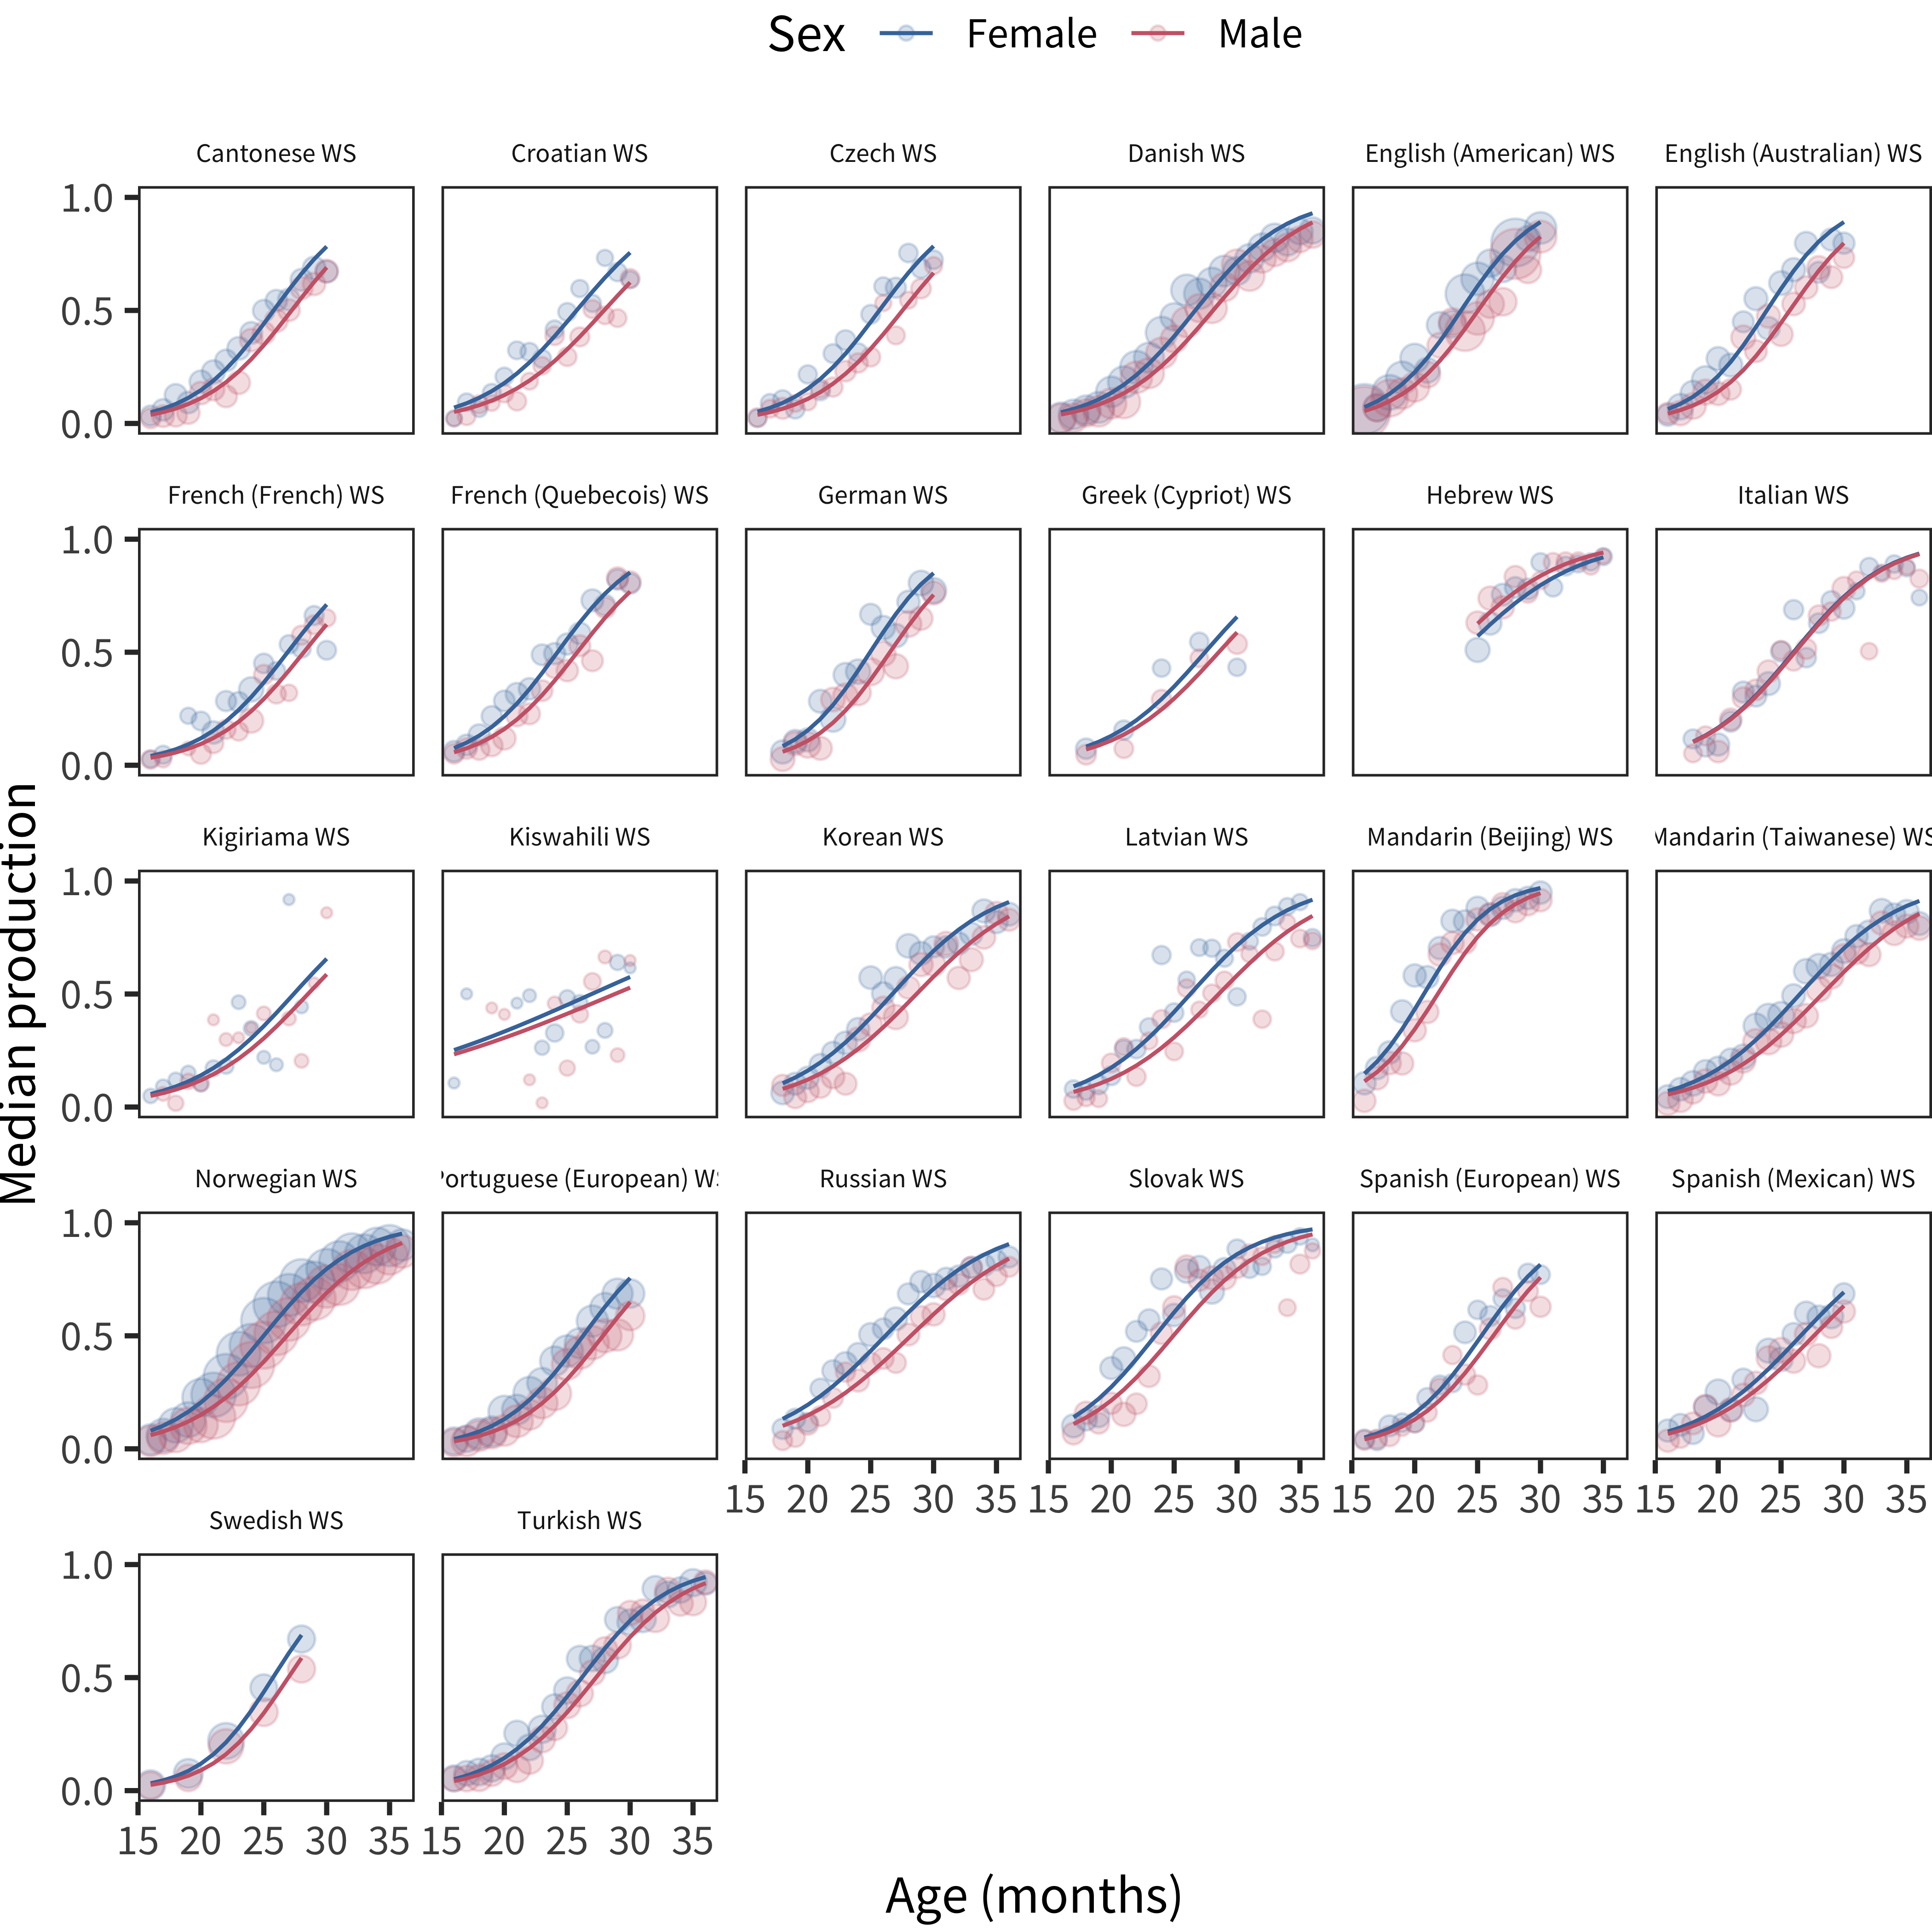
Figure 6.5: Differences in WS production scores by sex, plotted across age by language.

Figure 6.6: Interaction term between age and sex for WS production data in each language.
We next turn to the MMAD effect size measure (see Figure 6.7 and Figure 6.8). Here we see a relatively consistent difference across ages with perhaps a slight downward trend in effect size with age. This downward trend might be a function of ceiling effects on the form, however, as seen in the model-fit curves above for, e.g., Danish. When variability is limited by the form ceiling, effect size estimates will necessarily be depressed. The median female advantage is 0.40, substantially larger than that seen in early comprehension.
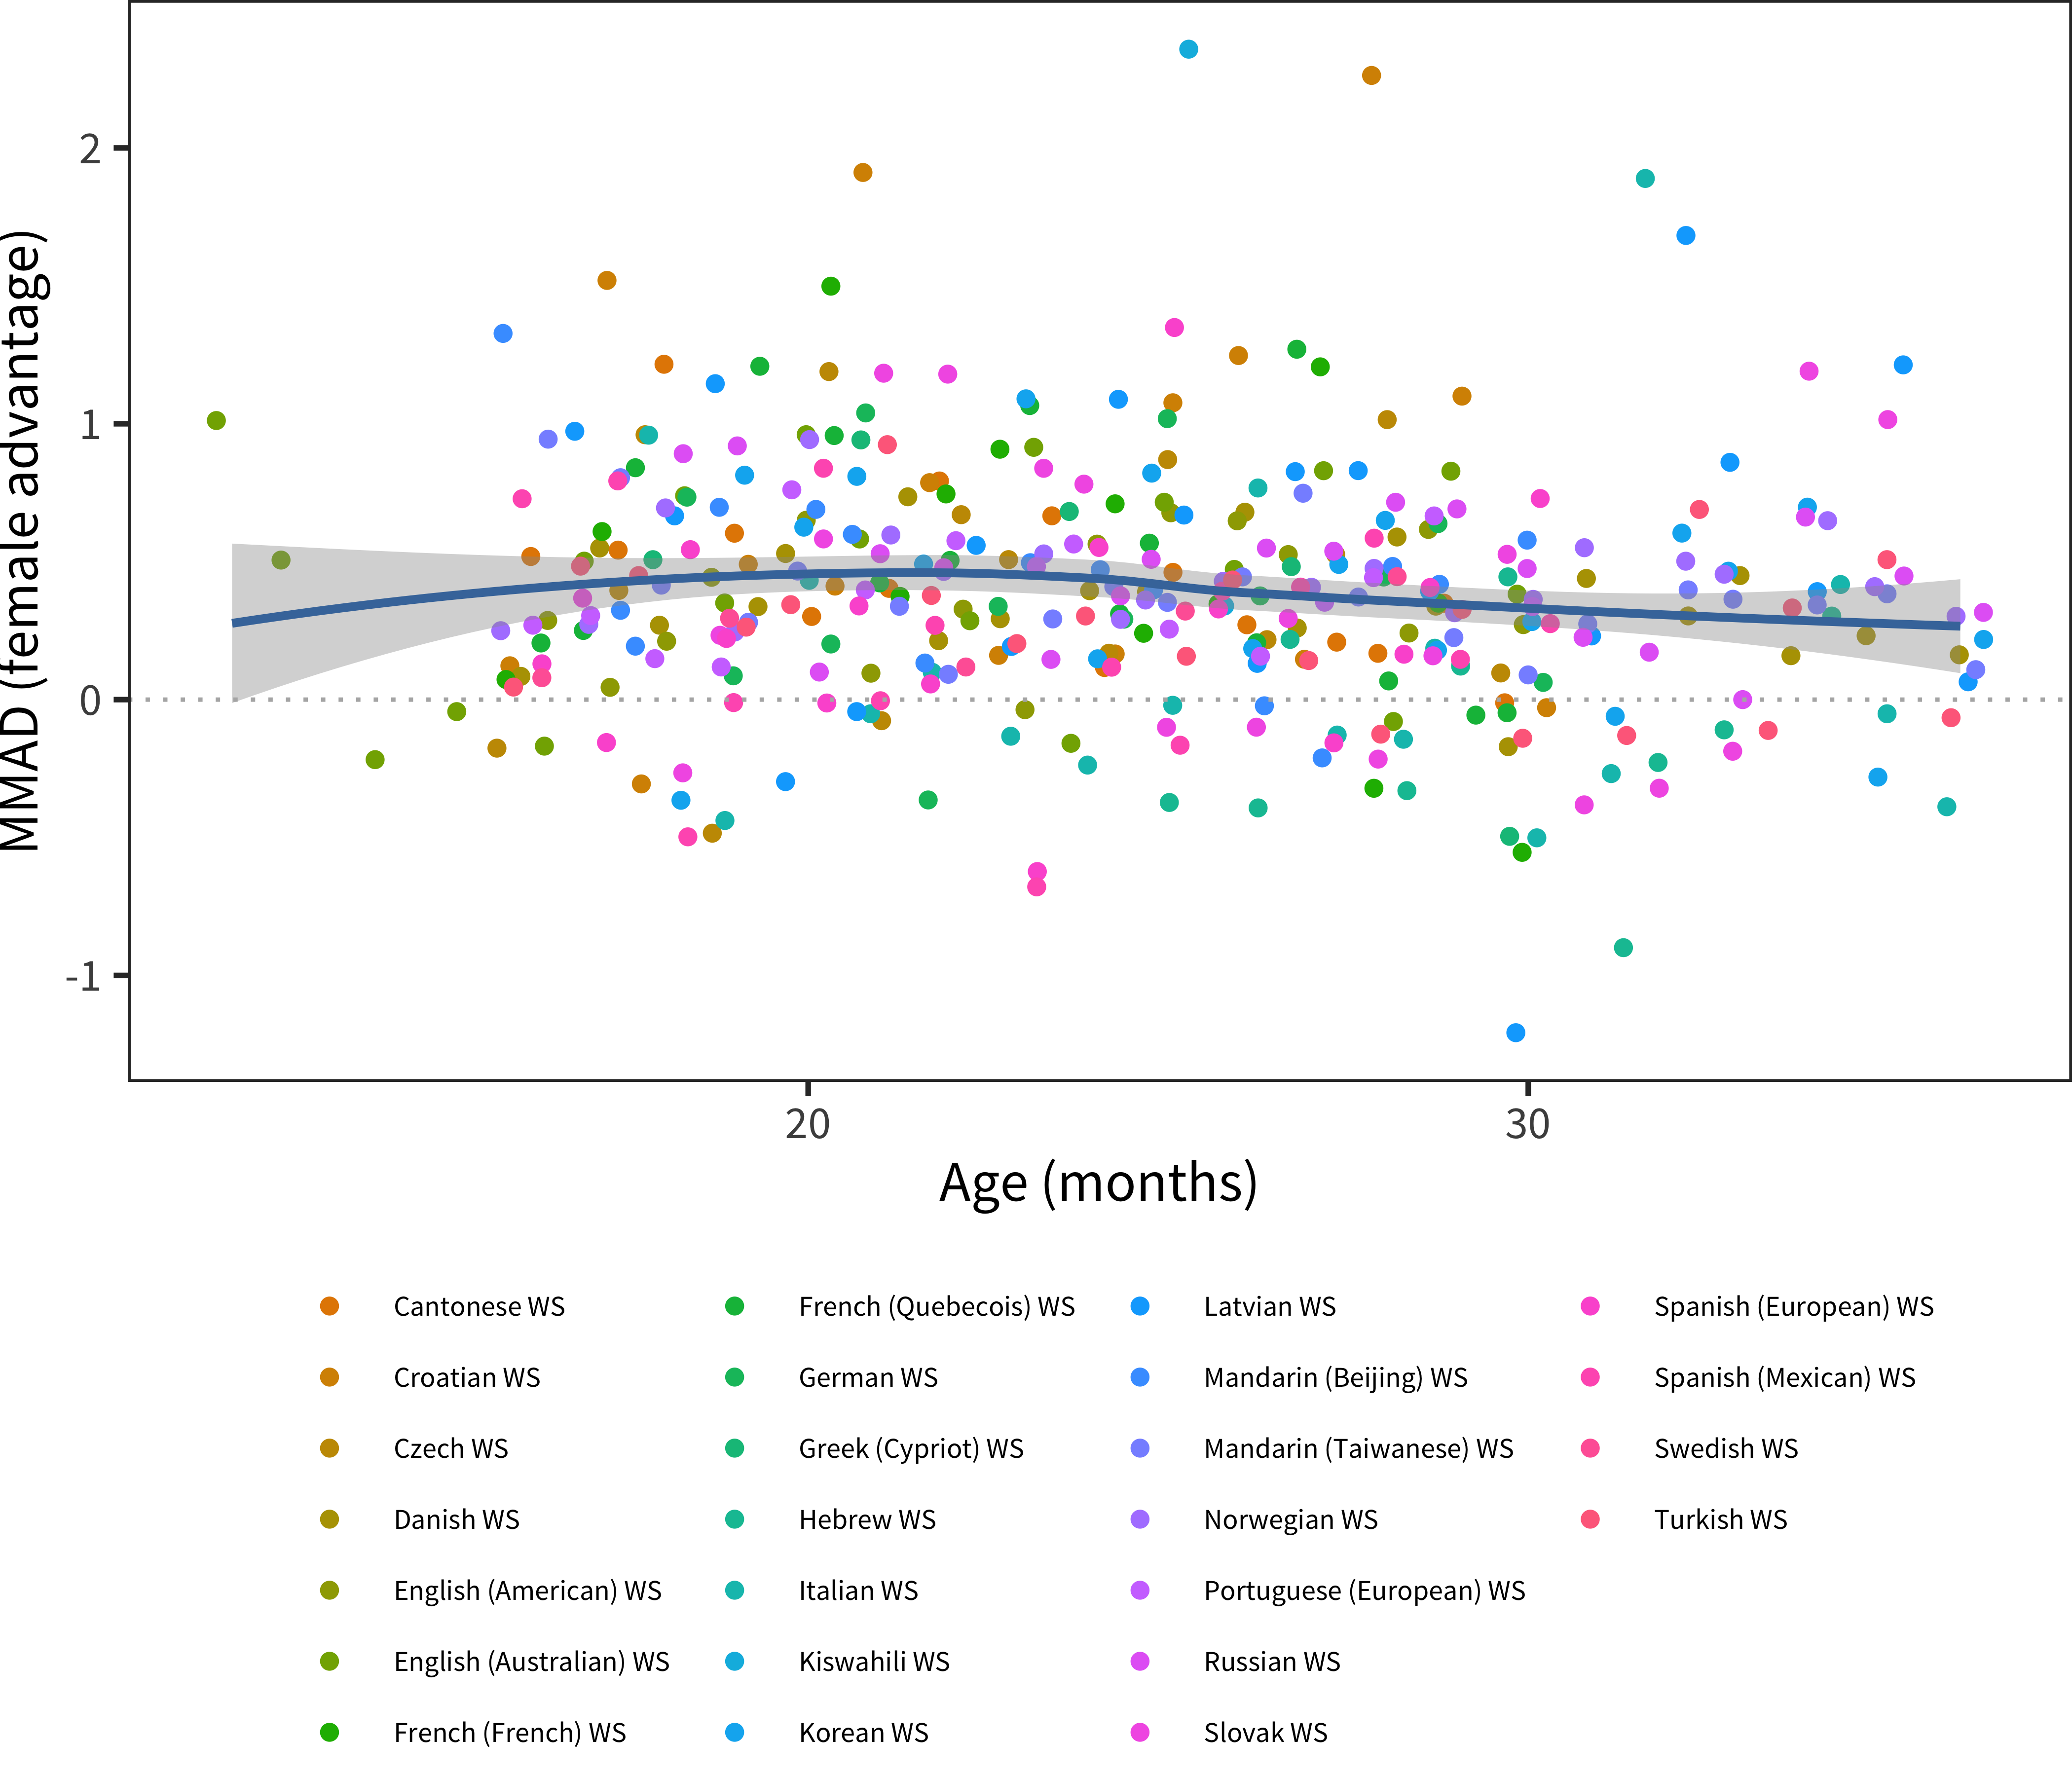
Figure 6.7: MMAD female advantage for WS production data in each language across age.
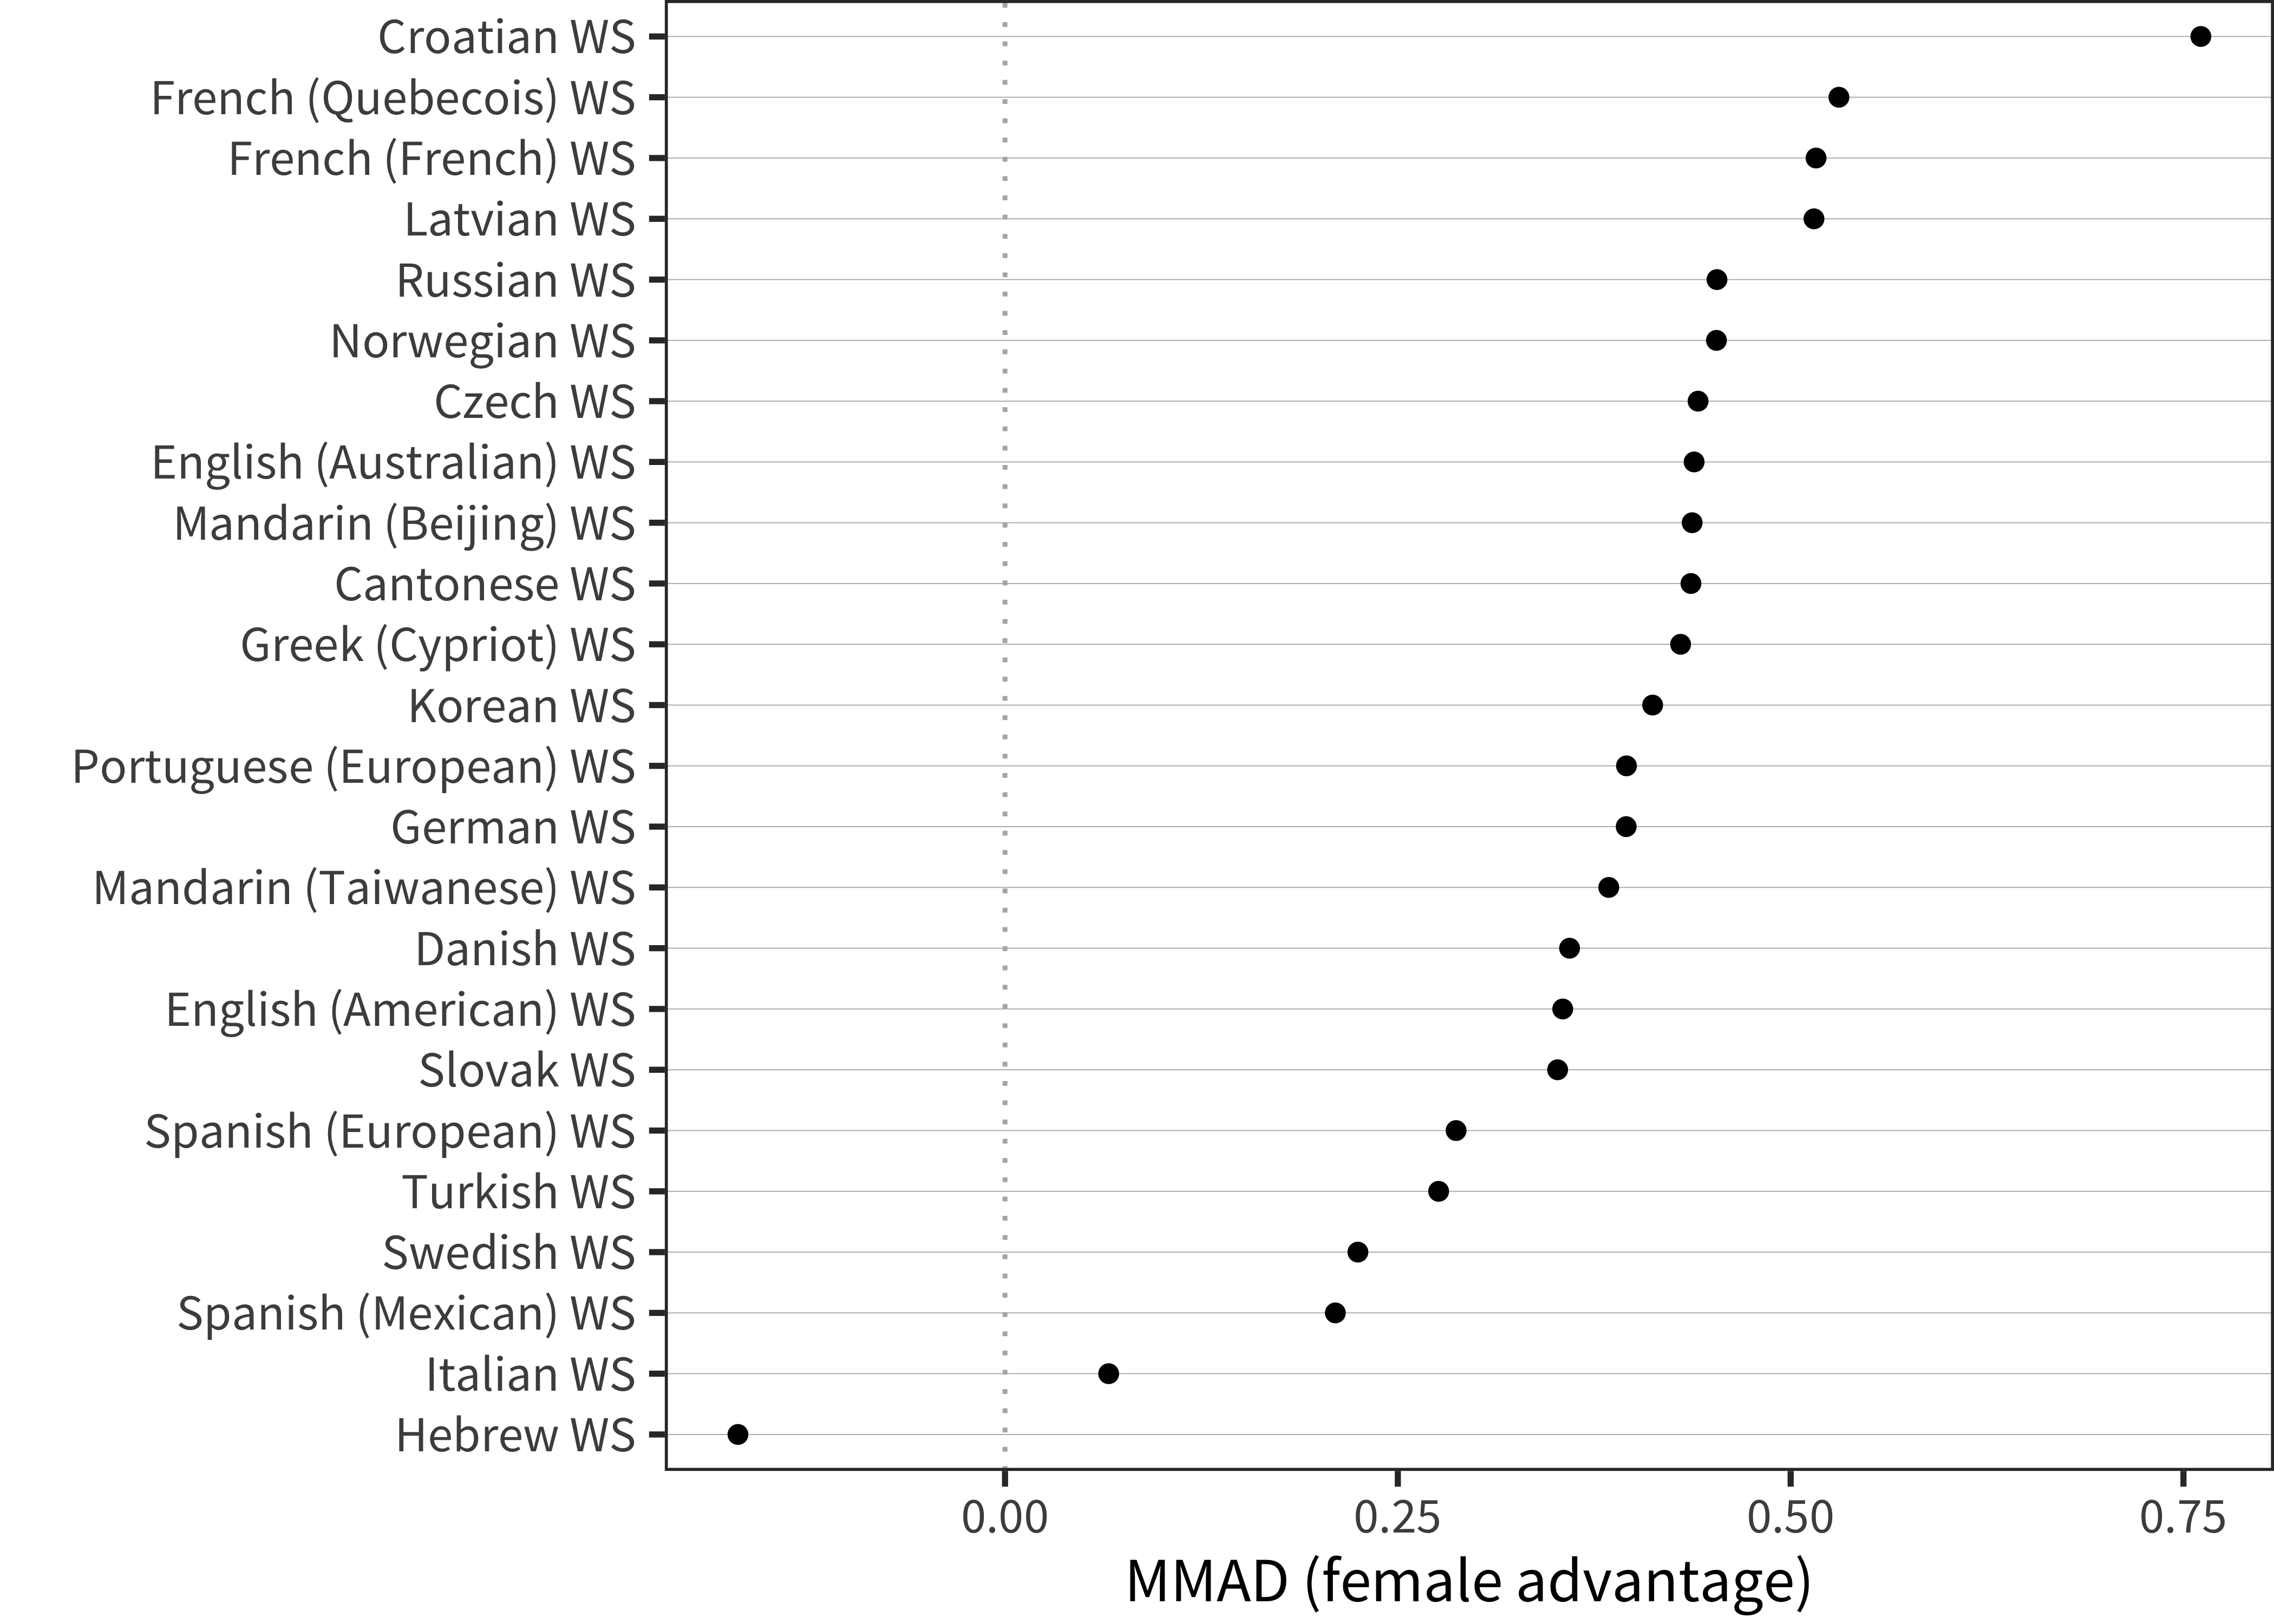
Figure 6.8: MMAD female advantage for WS production data in each language averaged over age.
6.1.3 Reporting bias?
Do these differences reflect differences in measurement that are unique to the CDI? One way of addressing this question is to examine other studies of gender differences. Unfortunately, many of the studies reporting differences themselves rely on the CDI or similar measures, likely for the reasons reviewed in Chapter 2, (e.g. Bauer, Goldfield, and Reznick 2002; Fenson et al. 1994; Feldman et al. 2000). For example, Feldman et al. (2000) collected CDIs with a large dataset of low-income American English speakers at 12 and 24 months. In those data, early comprehension showed no significant gender differences, but production at 24 months showed a difference comparable to what we observed here (N = 2156, d = .35, as recomputed from provided summary statistics). These data, while providing a replication in an independent dataset, do not speak to whether reporting biases contributed to or created the observed sex effects.
For external validation, we turn to two other studies that provide more objective (non parent-report) measurements of early language. First, a seminal study by Huttenlocher et al. (1991) measured gender effects in vocabulary production as estimated from a naturalistic language sample, finding substantial differences in vocabulary growth favoring girls. Although the measures from this study are not comparable totthose used in the current analysis, the effects were quite large (and were relatively unaffected by controlling for maternal language exposure).
Second, Bornstein and Putnick (2012) used a particularly powerful study design to examine stability in early language estimates across different measures. They gathered longitudinal data at 20 and 48 months using a wide range of standardized and parent-report measures, and then used structural equation modeling to model shared variance due to parent report as well as to standardized latent language ability at each age. We digitized data from their Figure 2 to examine the size of the gender differences in the latent vocabulary construct that they recovered (see Figure 6.9).16 As these scores are standardized, we can examine the difference in means and recover an estimate of the standardized effect size for gender in the data, which is 0.62 standard deviations. Since this measurement is greater than that found using the CDIs (the comparable American English measurement was 0.35), this observation gives us resaon to doubt that our observed effect is due solely to reporting bias.
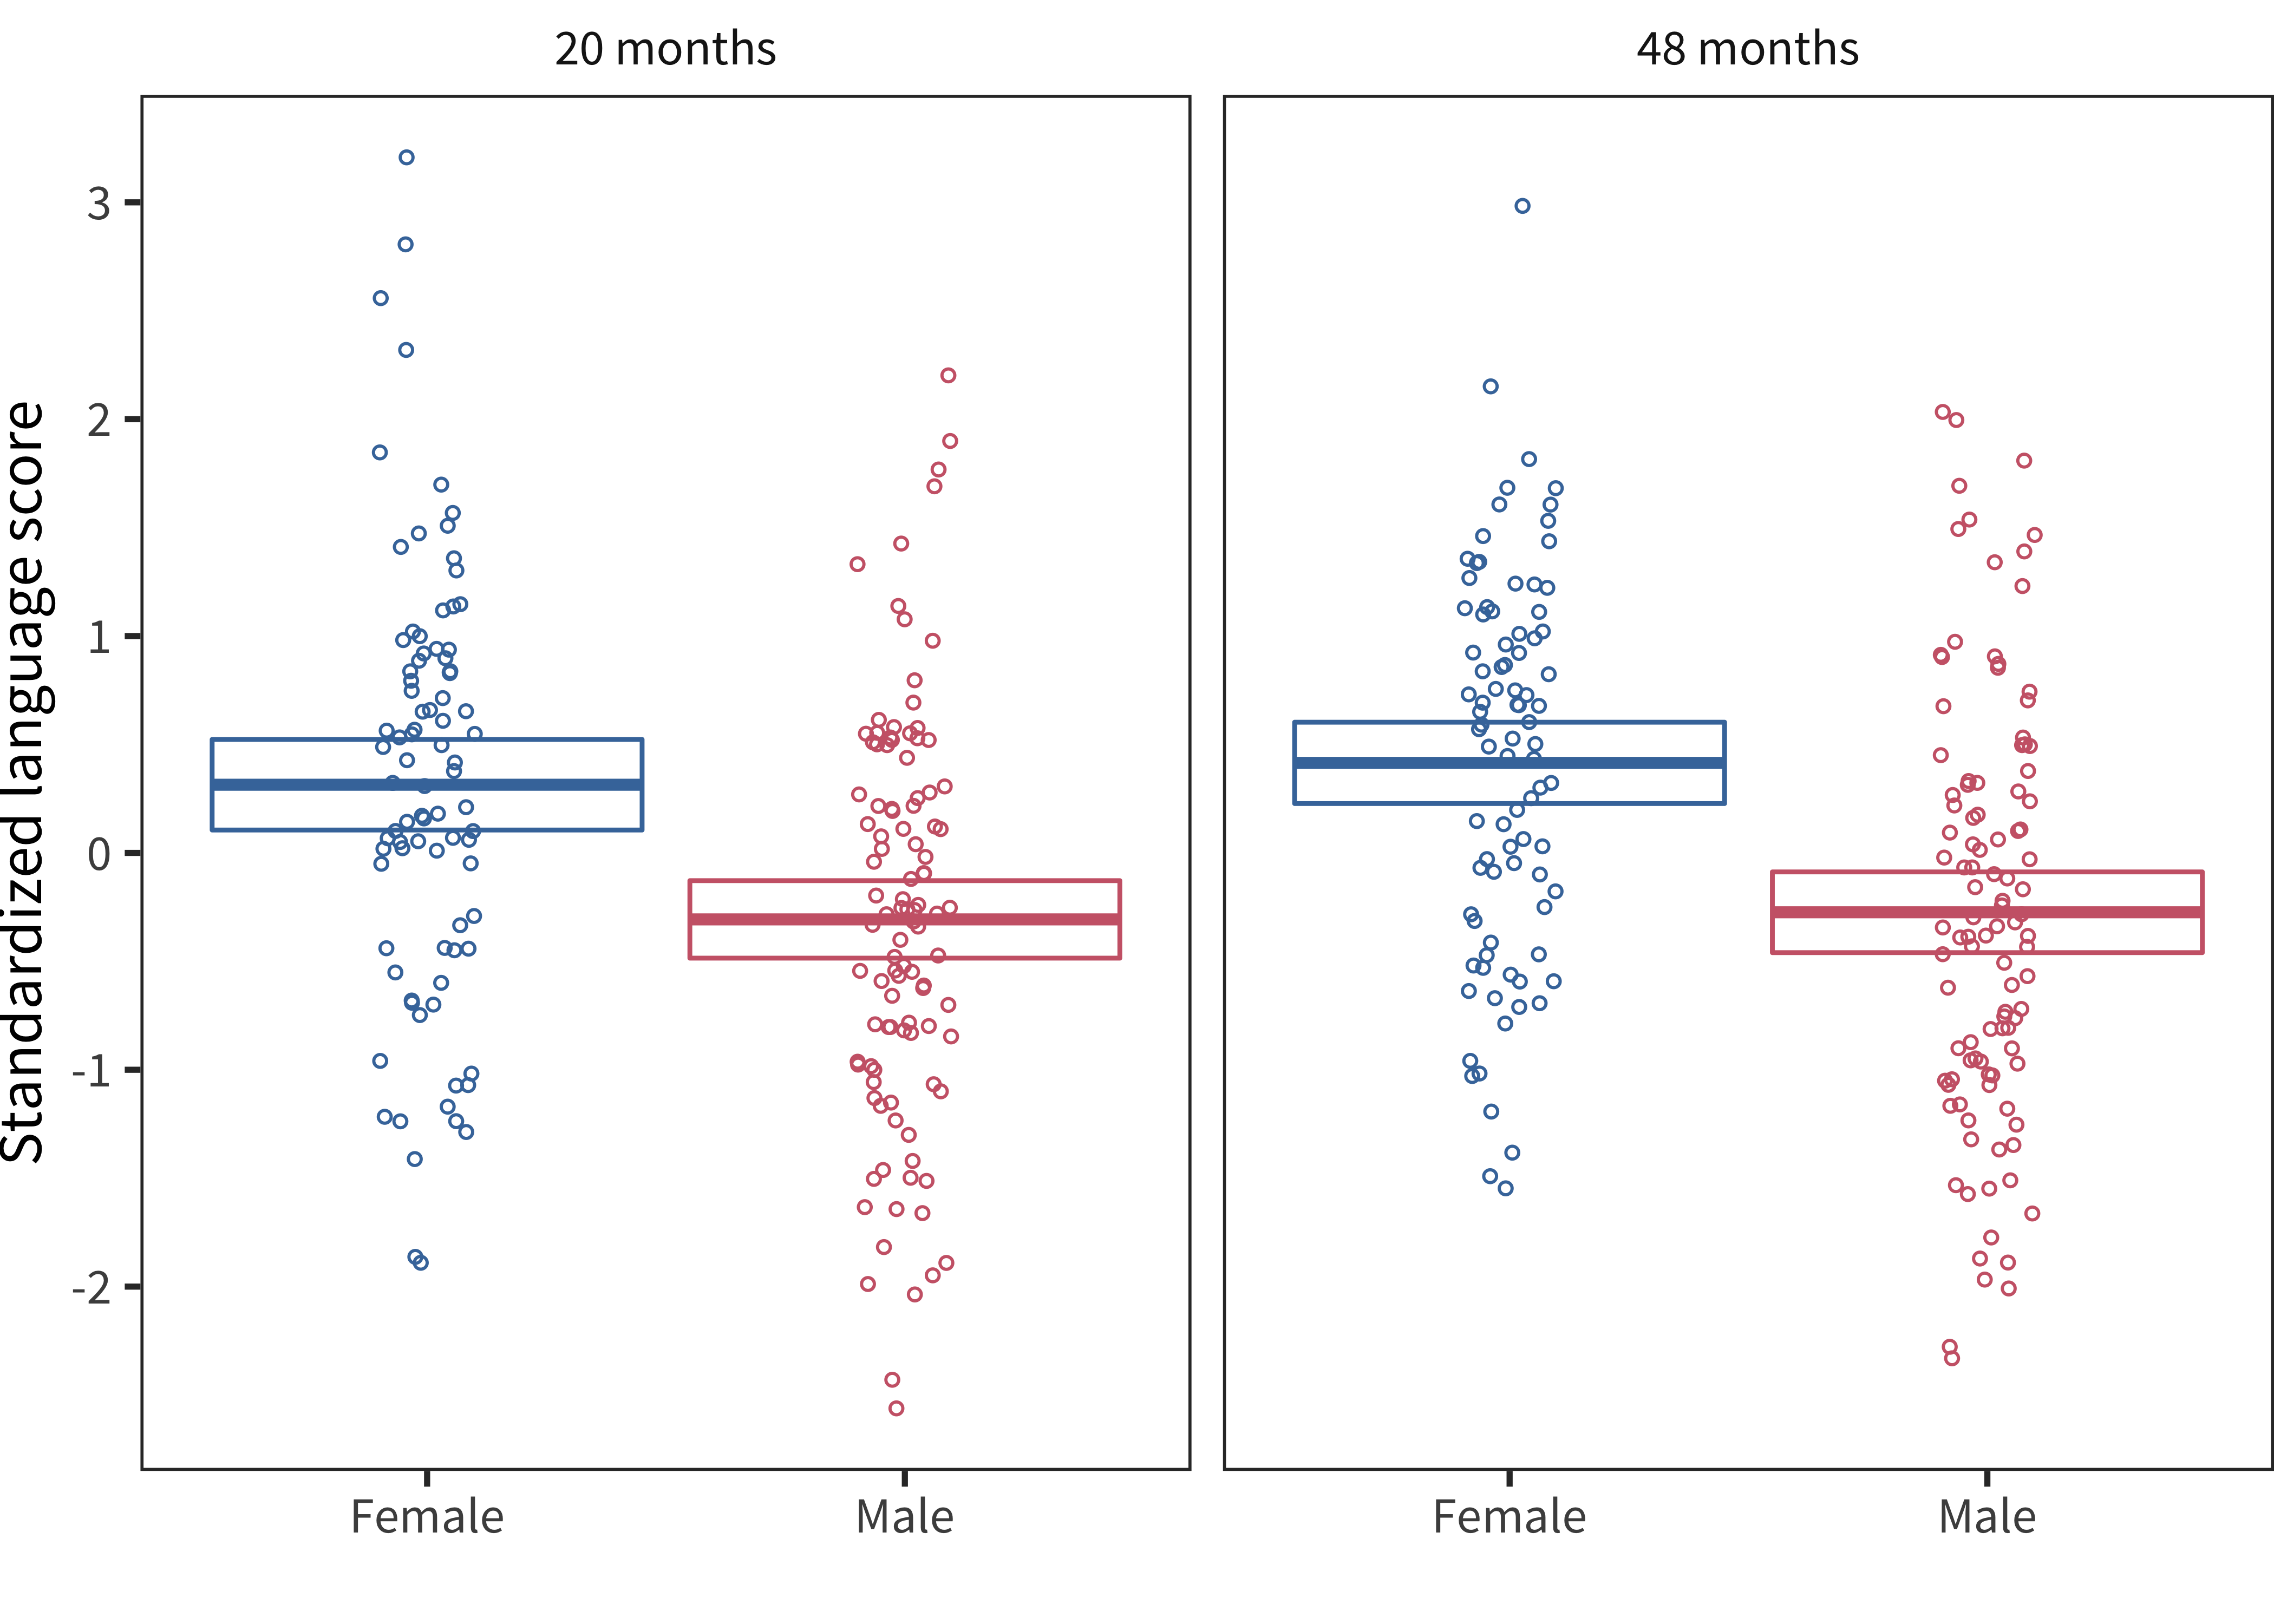
Figure 6.9: Latent vocabulary scores from Bornstein and Putnick (2012) by age and sex (crossbars show means and 95 percent confidence intervals).
6.1.4 Discussion
In summary, we found a considerable and strikingly consistent cross-linguistic female advantage in early language production (replicating and extending Eriksson et al. 2012). A much smaller but still relatively consistent female advantage was reported in comprehension. We suspect that neither of these effects are due to parental reporting bias. First, our review of the literature suggests that studies using direct assessments yield similar effects to the extent that we were able to compare. Second, comprehension is very likely to be the measure more affected by reporting biases as it is likely to be more subjective (Feldman et al. 2000; L. Fenson, Bates, et al. 2000), yet we find a much smaller gender effect in comprehension. As noted above, we remain agnostic about the causes of these differences. In Chapter 16, we speculate about inferences from consistency in sex differences across languages.
6.2 Birth order
Another factor that likely contributes to individual differences in children’s vocabulary development is birth order. The literature suggests some evidence for a first-born advantage in early vocabulary development, but these differences are small and tend to be most evident early in development. For example, Bornstein et al. (2004) found that mothers report larger receptive and expressive vocabularies in their first-borns. Using naturalistic language samples, Berglund, Eriksson, and Westerlund (2005) found that first-born children reached the 50-word milestone earlier than later-born children, but that birth order differences diminished later in development. Finally, Hoff-Ginsberg (1998) found that first-born children were more advanced in vocabulary development than later-born children, but that later-born children were more advanced in their conversational skills.
One dissenting report comes from Oshima-Takane, Goodz, and Derevensky (1996), who found that second-born children were relatively equivalent in general language proficiency. They also found that second-born children were more proficient with personal pronouns, a suggestion that we investigate in Chapter 9. They used this equivalence to argue for second-born children’s ability to learn from overhearing. Although we agree with this general suggestion, their failure to observe a first-born advantage for overall language proficiency is likely due to the small sample size in their study (N=20).
Here, we can examine birth order effects in early vocabulary comprehension and production in a subset of languages in our sample: 12 languages have birth order data, with data available for 11 languages for Words & Sentences, and 8 languages for Words & Gestures.
6.2.1 Comprehension (WG)
We perform the same set of analyses as for sex, shown in Figure 6.10, Figure 6.11, Figure 6.12, and Figure 6.13.
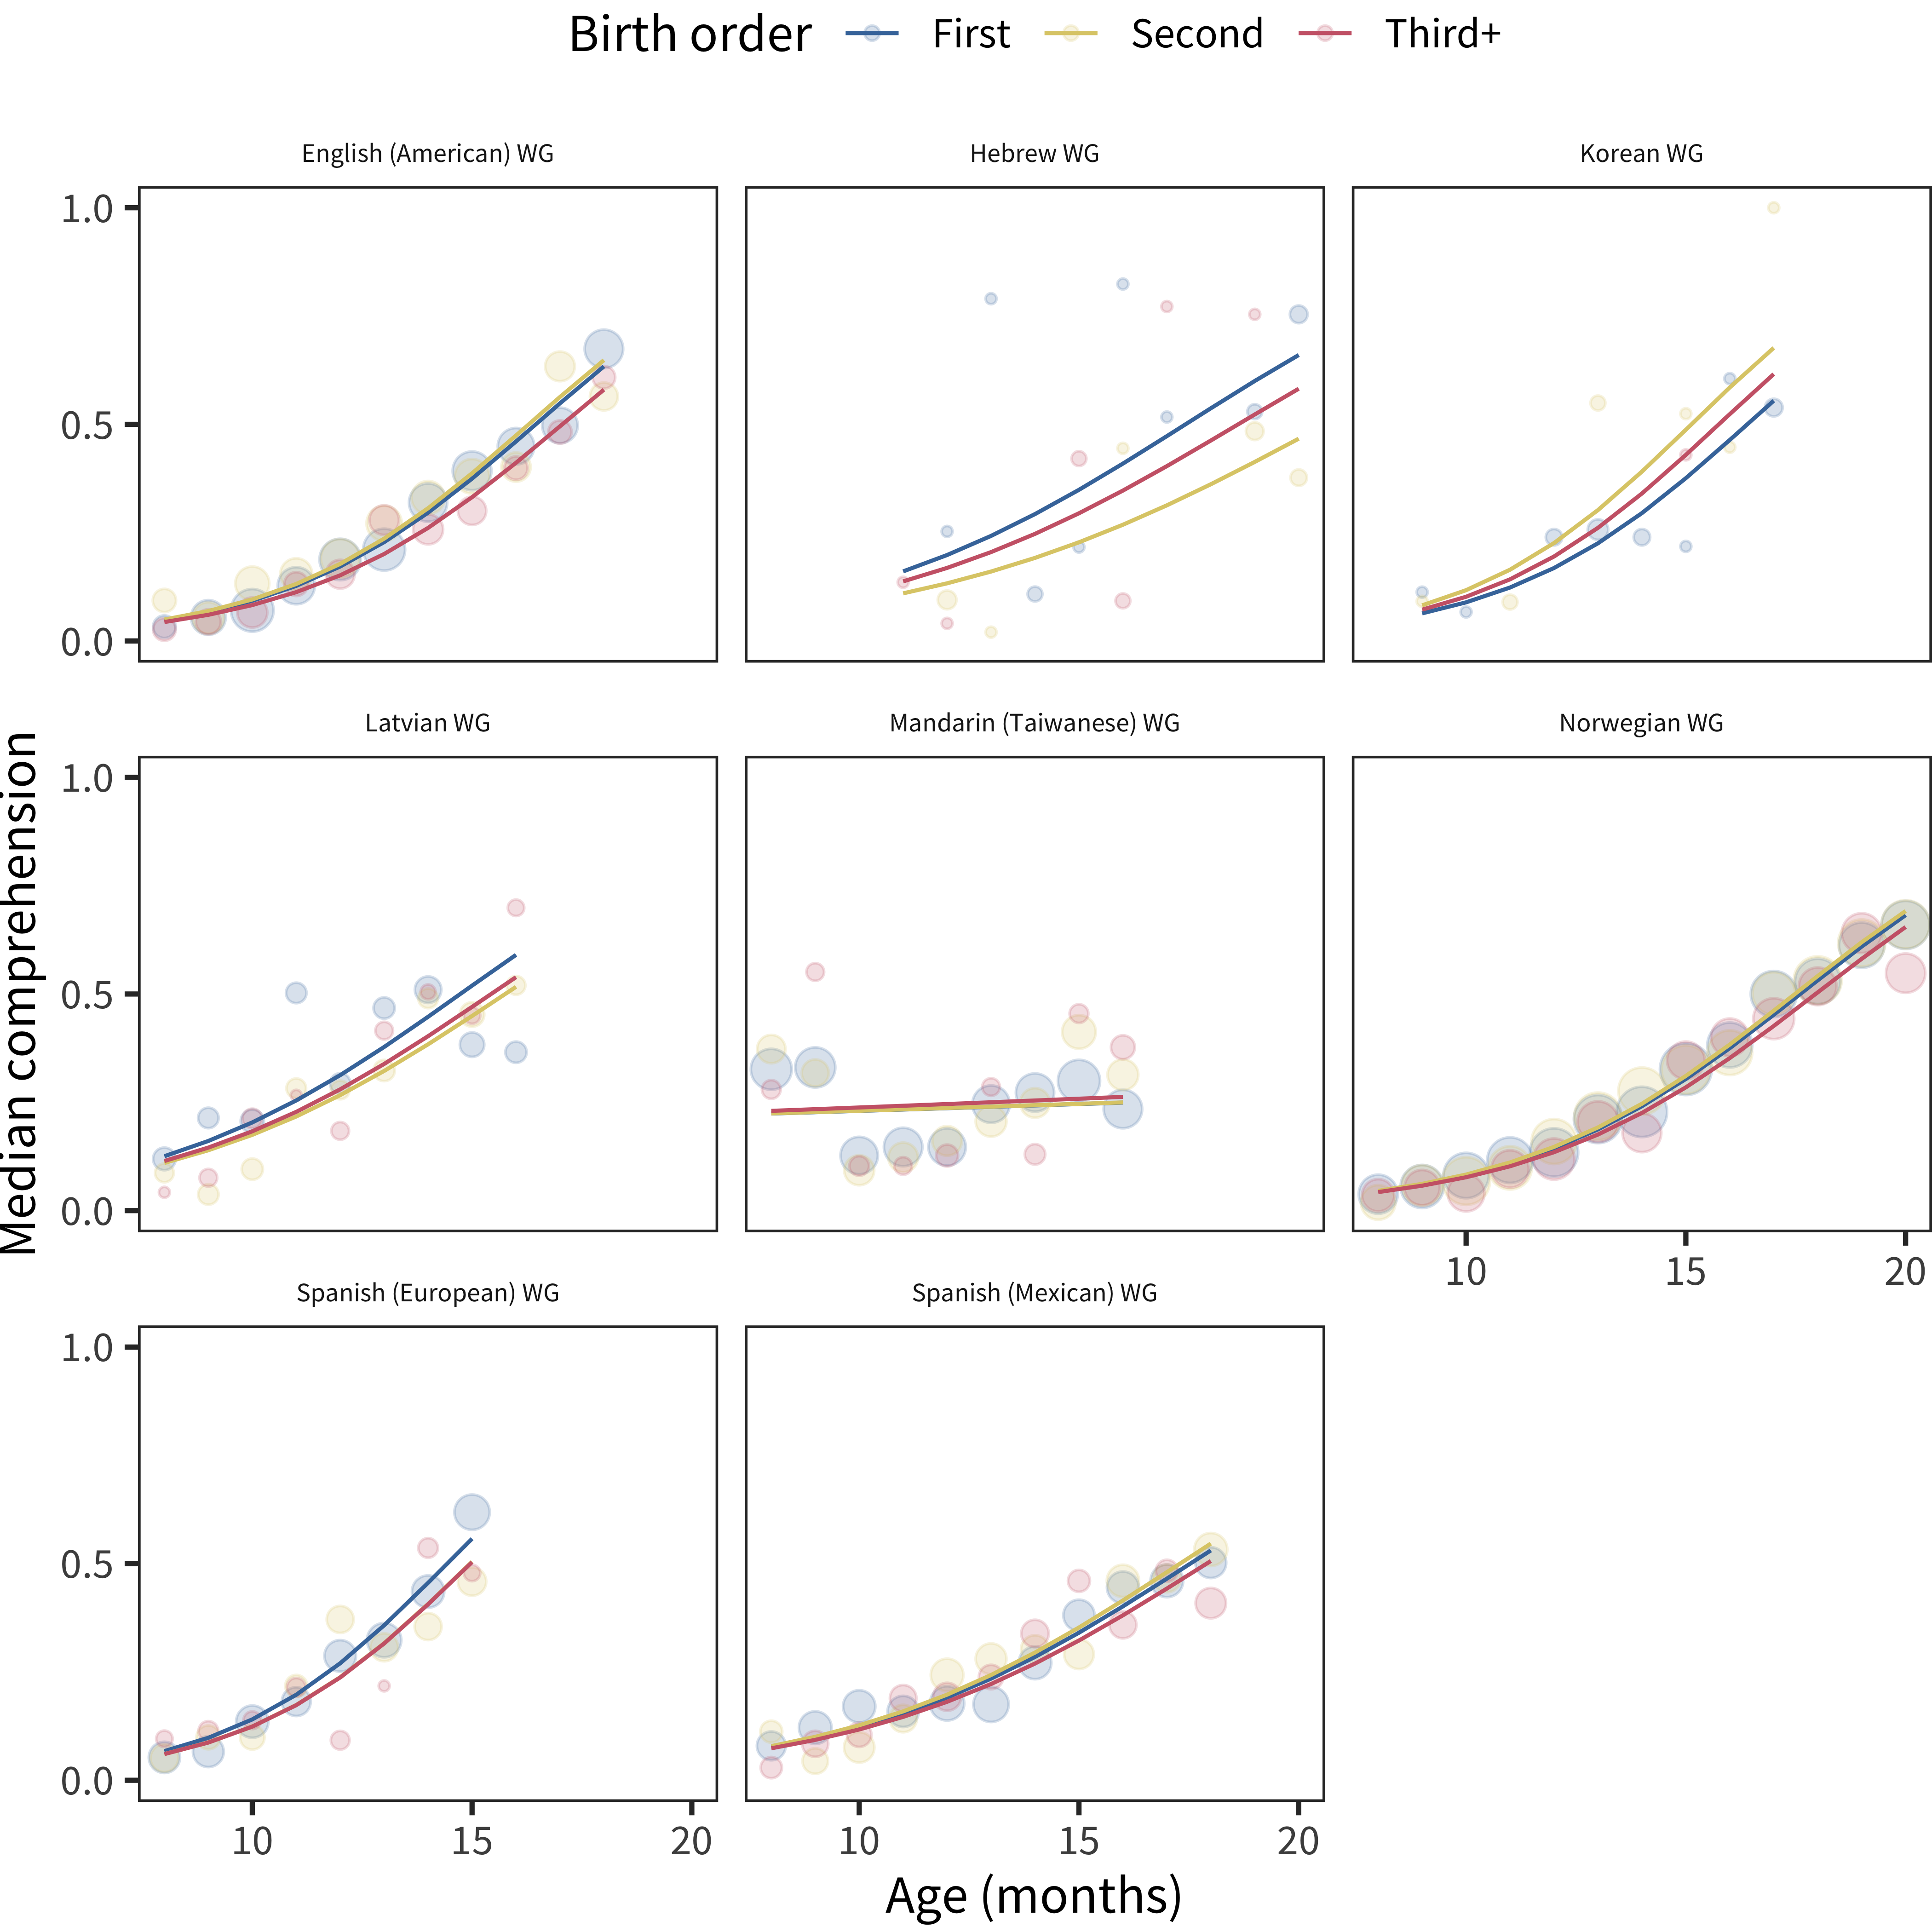
Figure 6.10: Differences in WG comprehension scores by birth order, plotted across age by language.
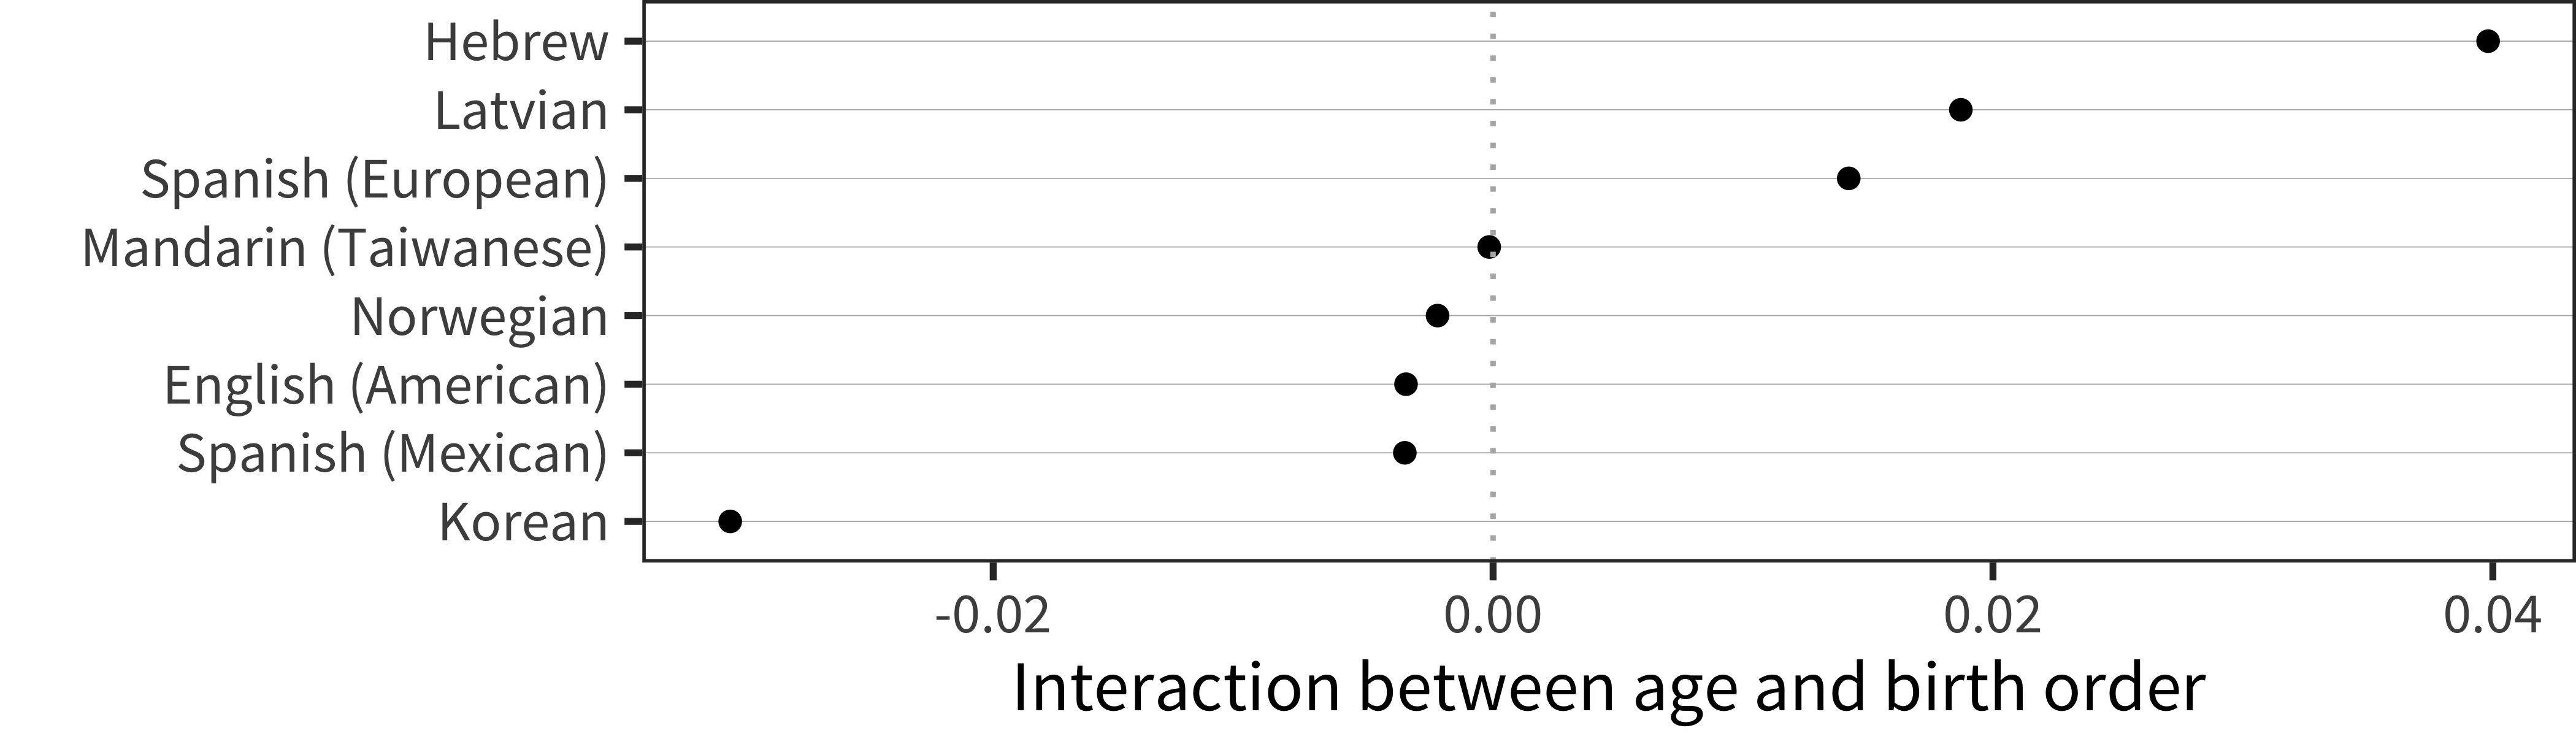
Figure 6.11: Interaction term between age and birth order for WG production data in each language.
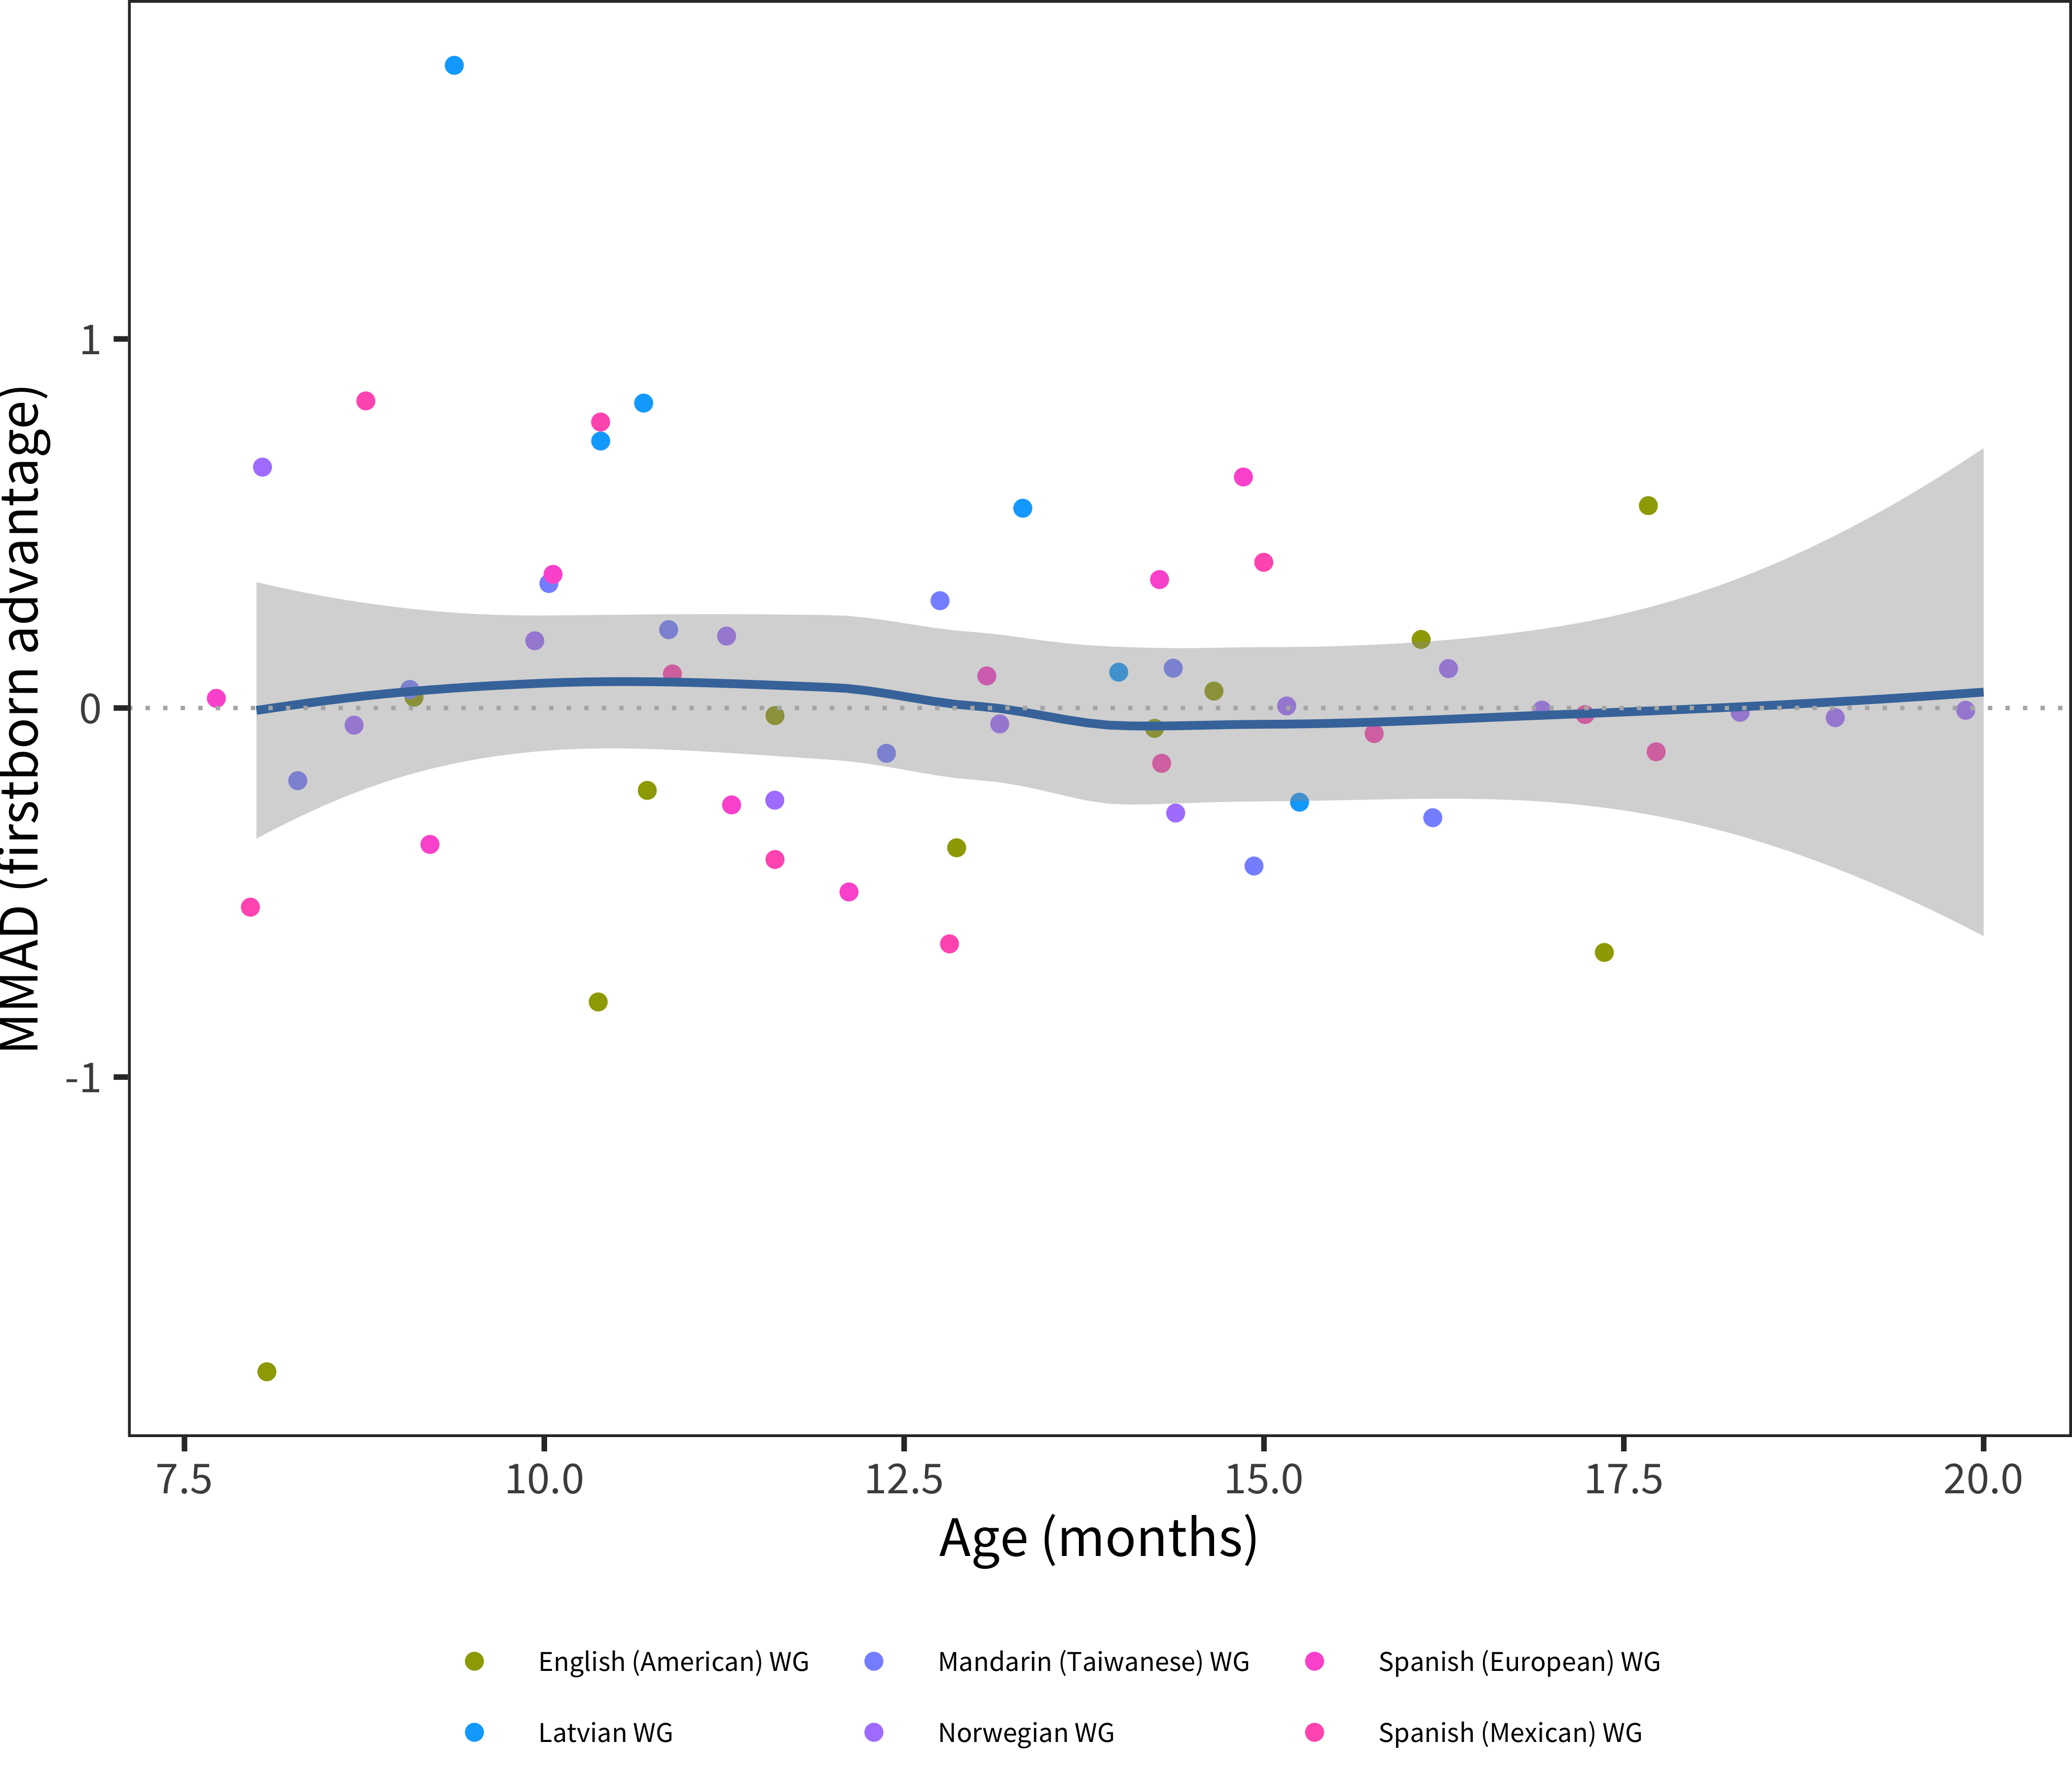
Figure 6.12: MMAD first-born advantage for WG comprehension data in each language across age.
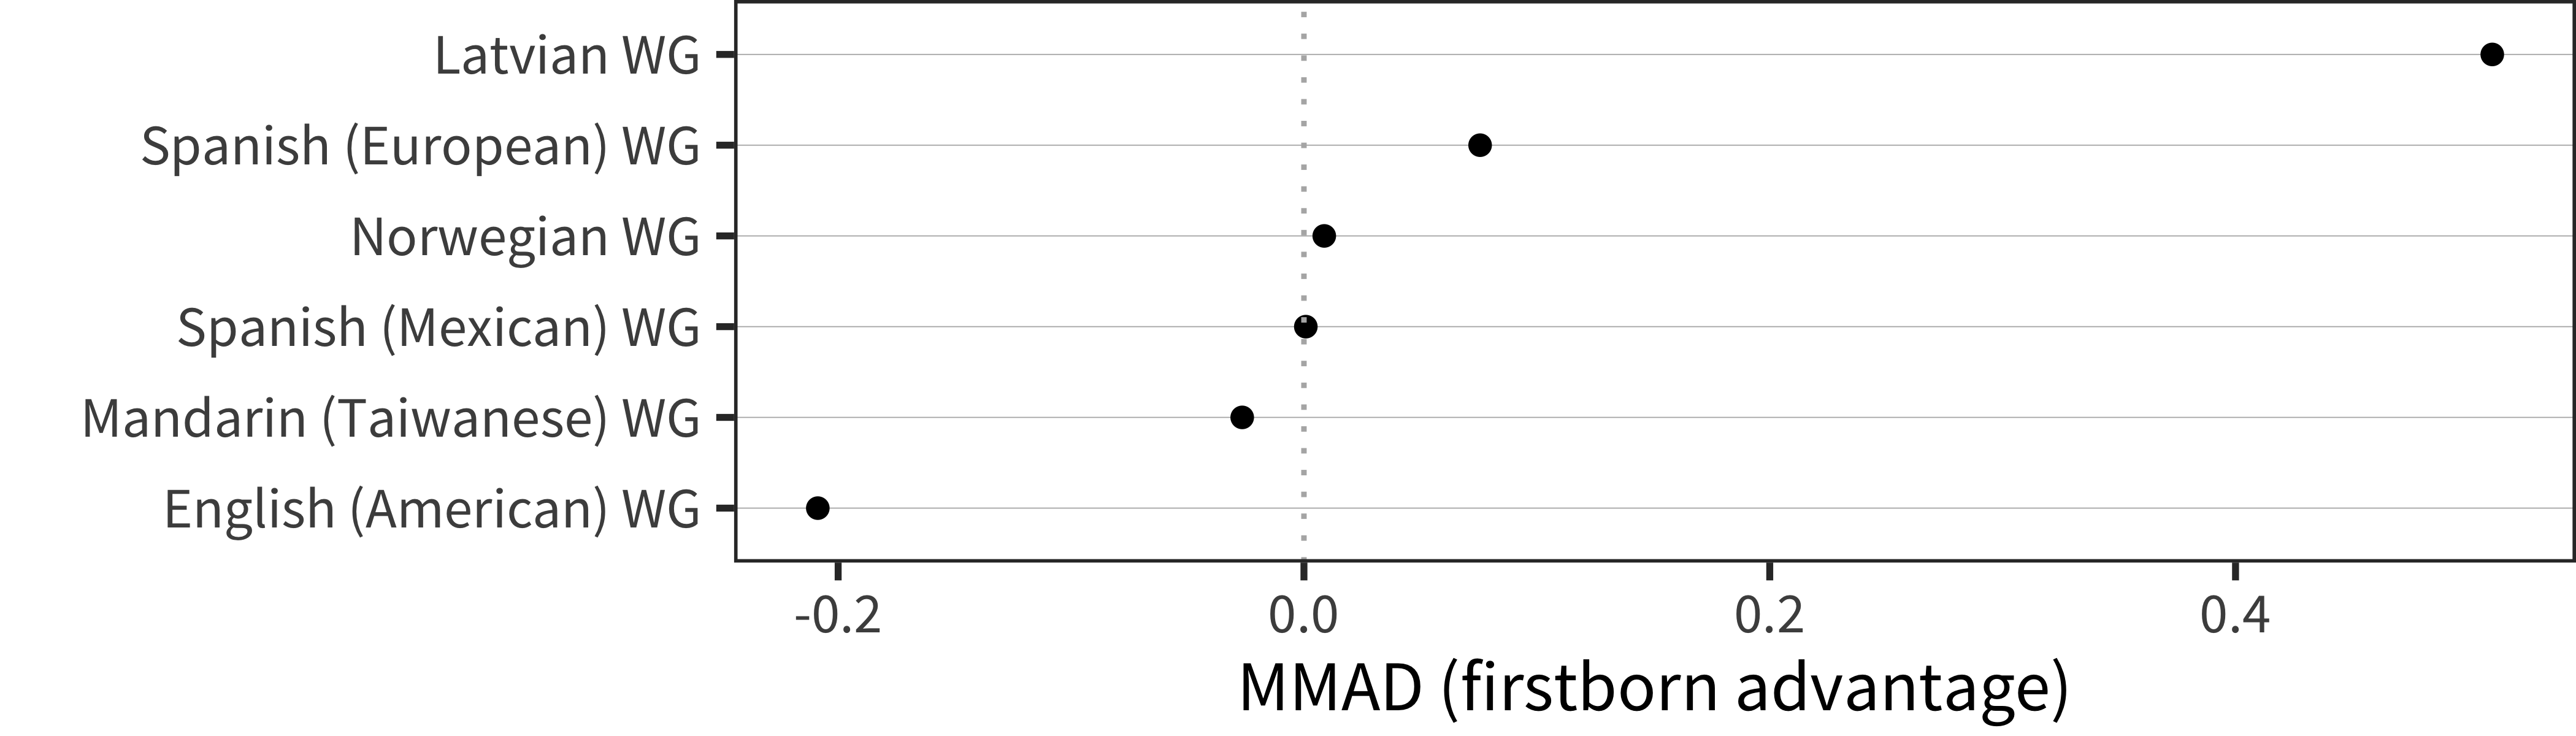
Figure 6.13: MMAD first-born advantage for WG comprehension data in each language averaged over age.
6.2.2 Production (WS)
The parallel set of analyses for WS Production data are shown in Figure 6.14, Figure 6.15, Figure 6.16, and Figure 6.17.
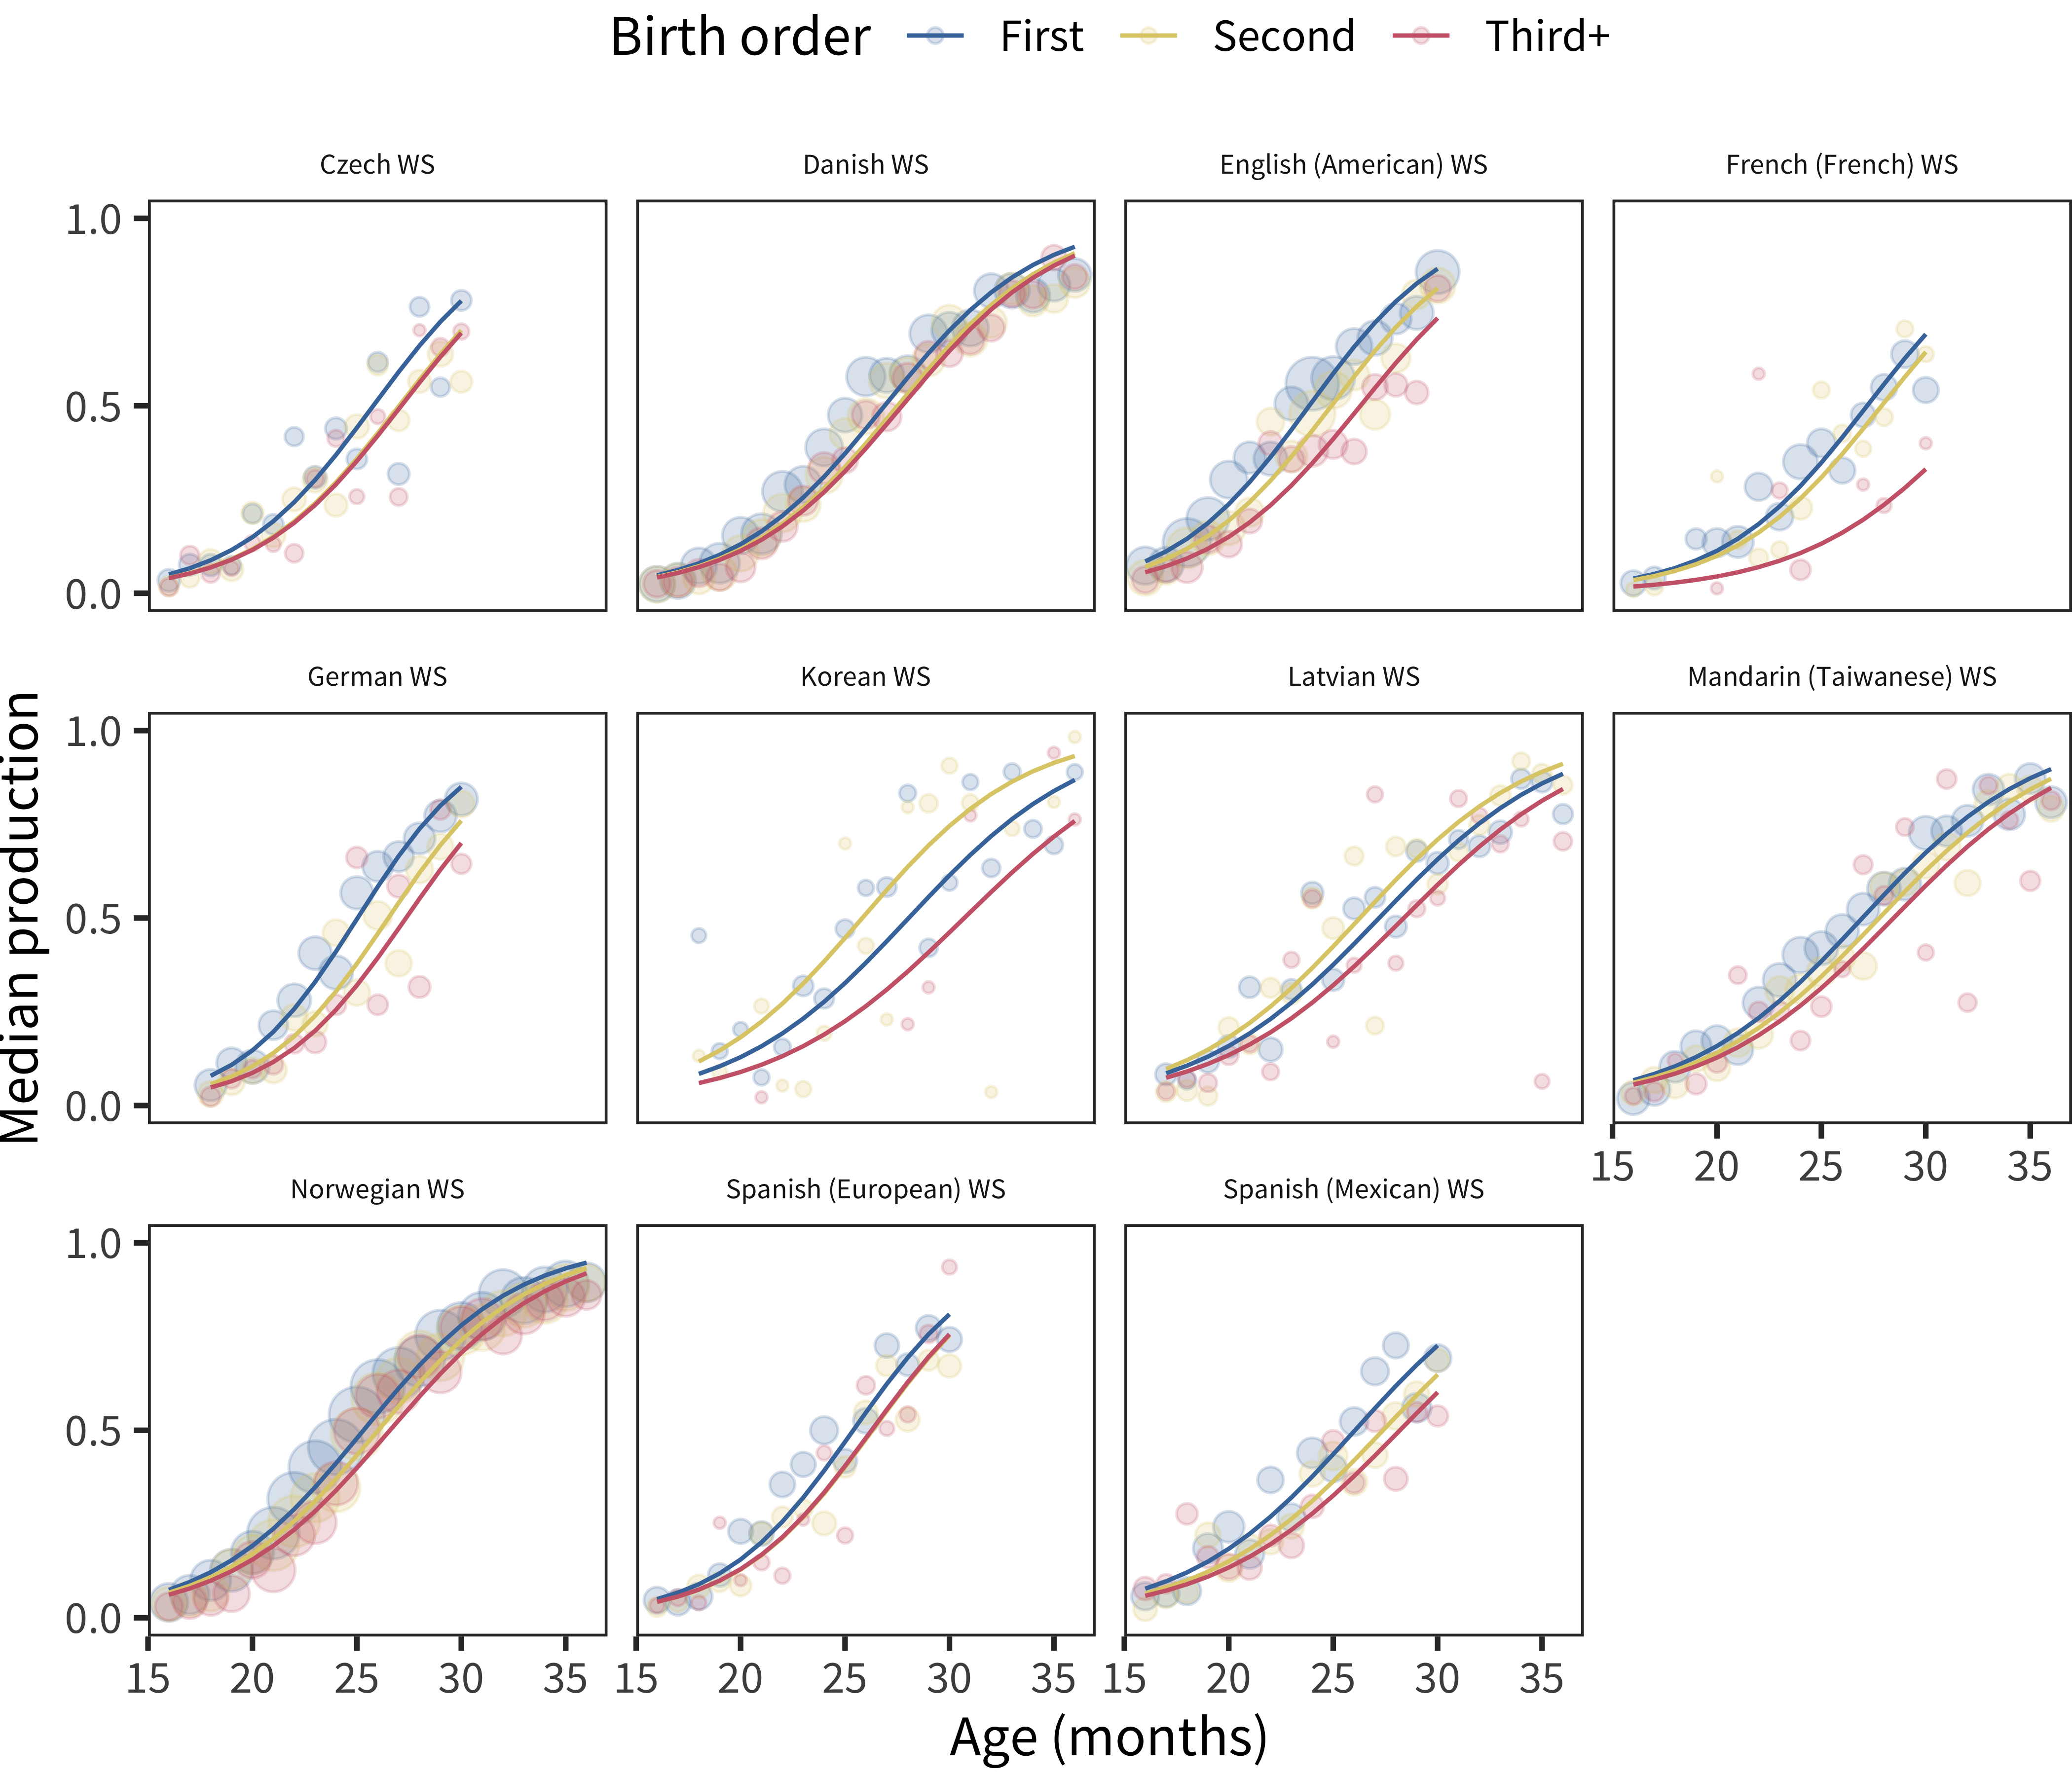
Figure 6.14: Differences in WS production scores by birth order, plotted across age by language.
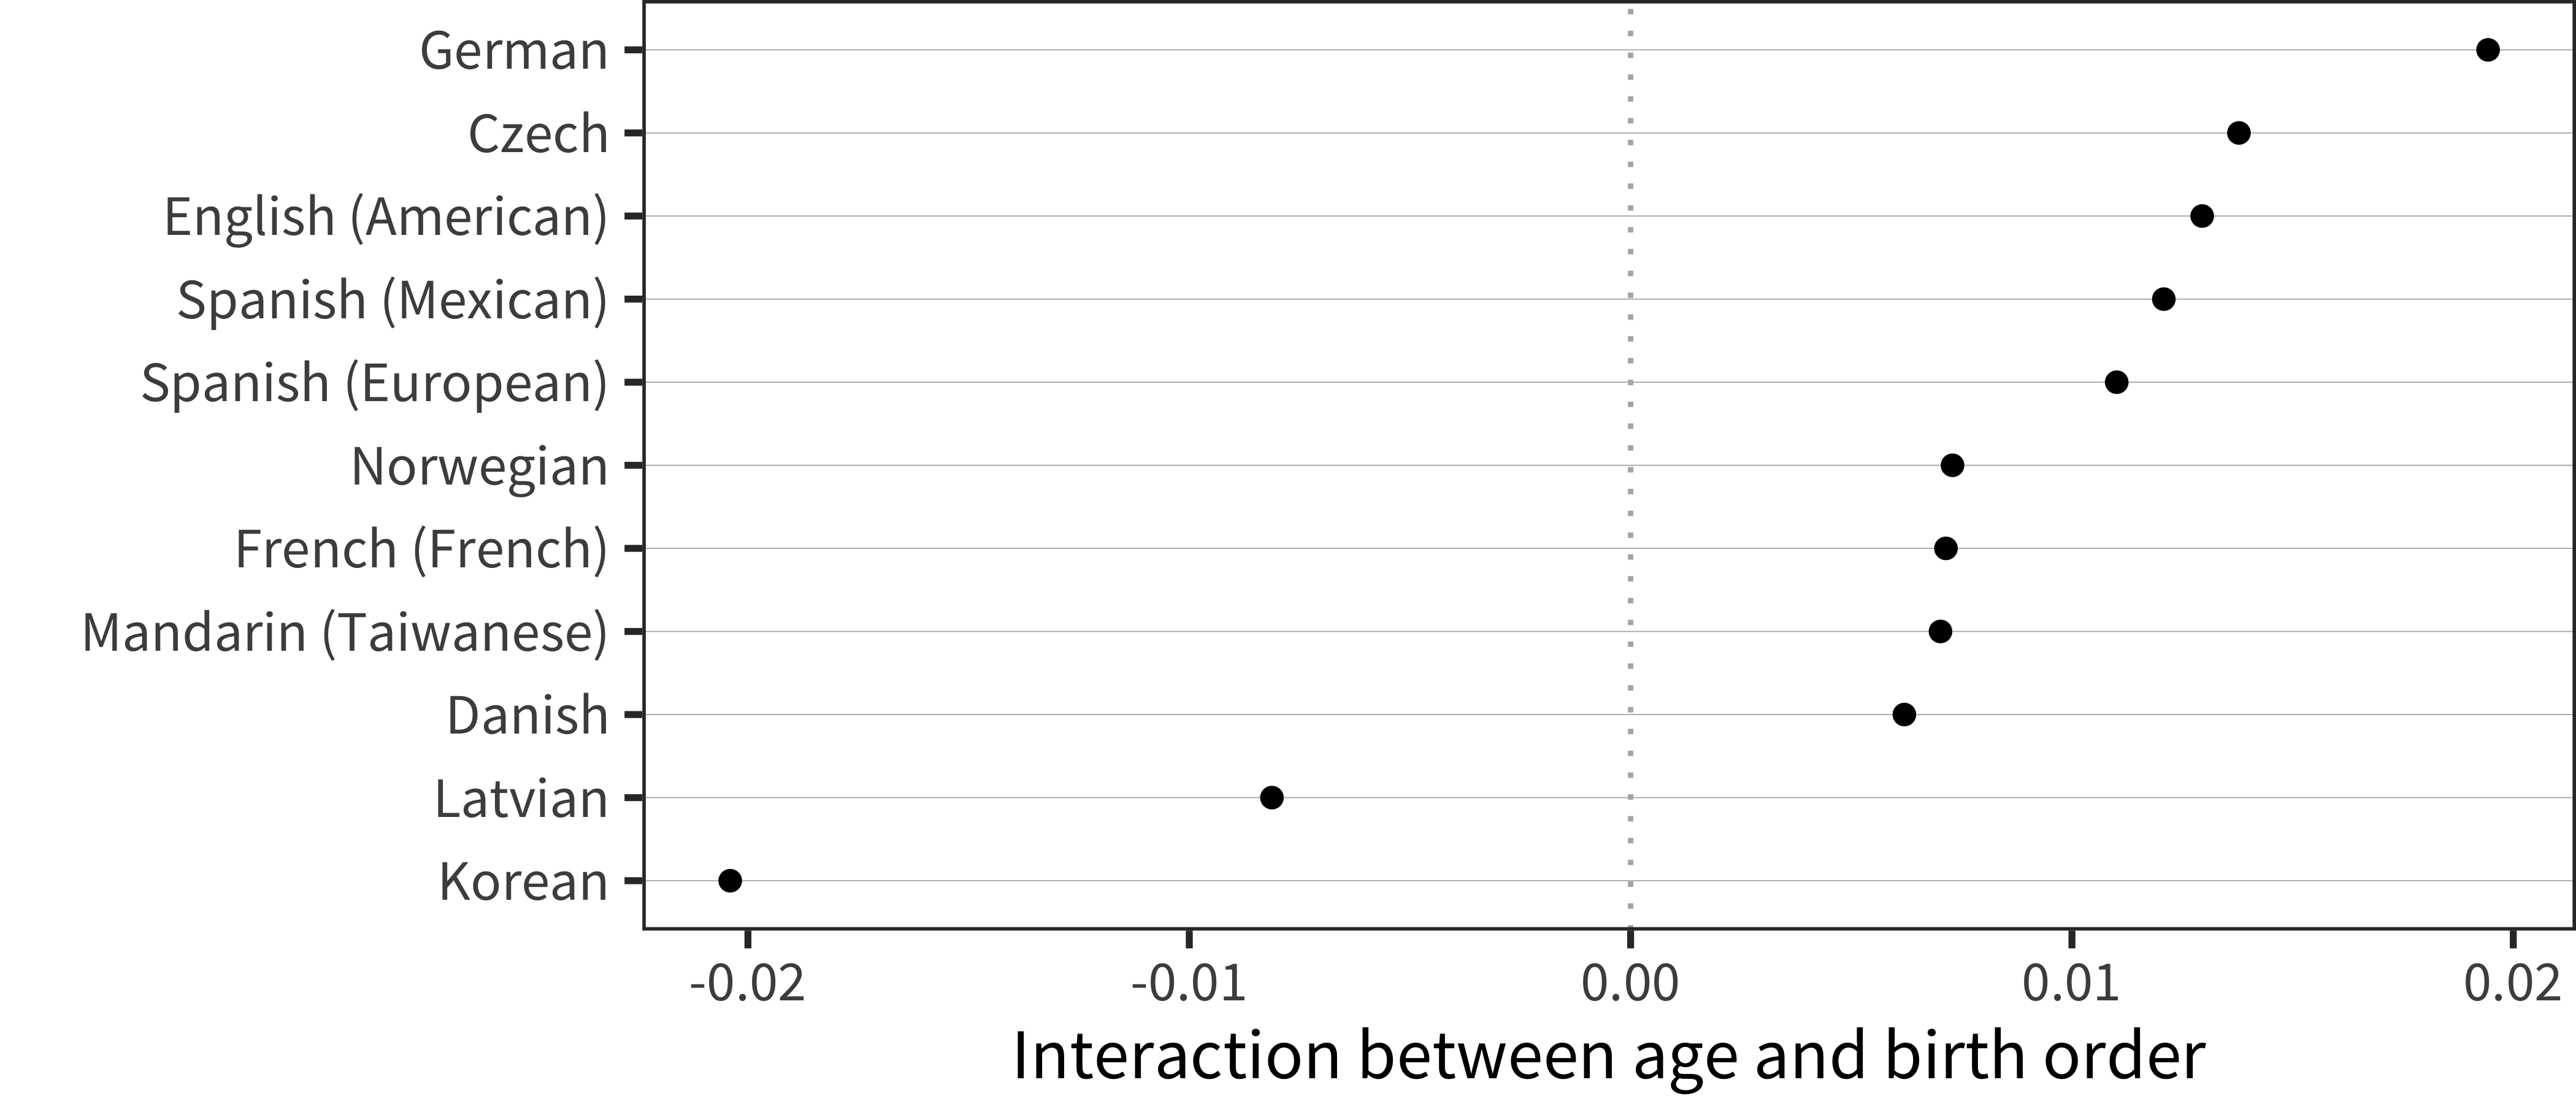
Figure 6.15: Interaction term between age and birth order for WS production data in each language.
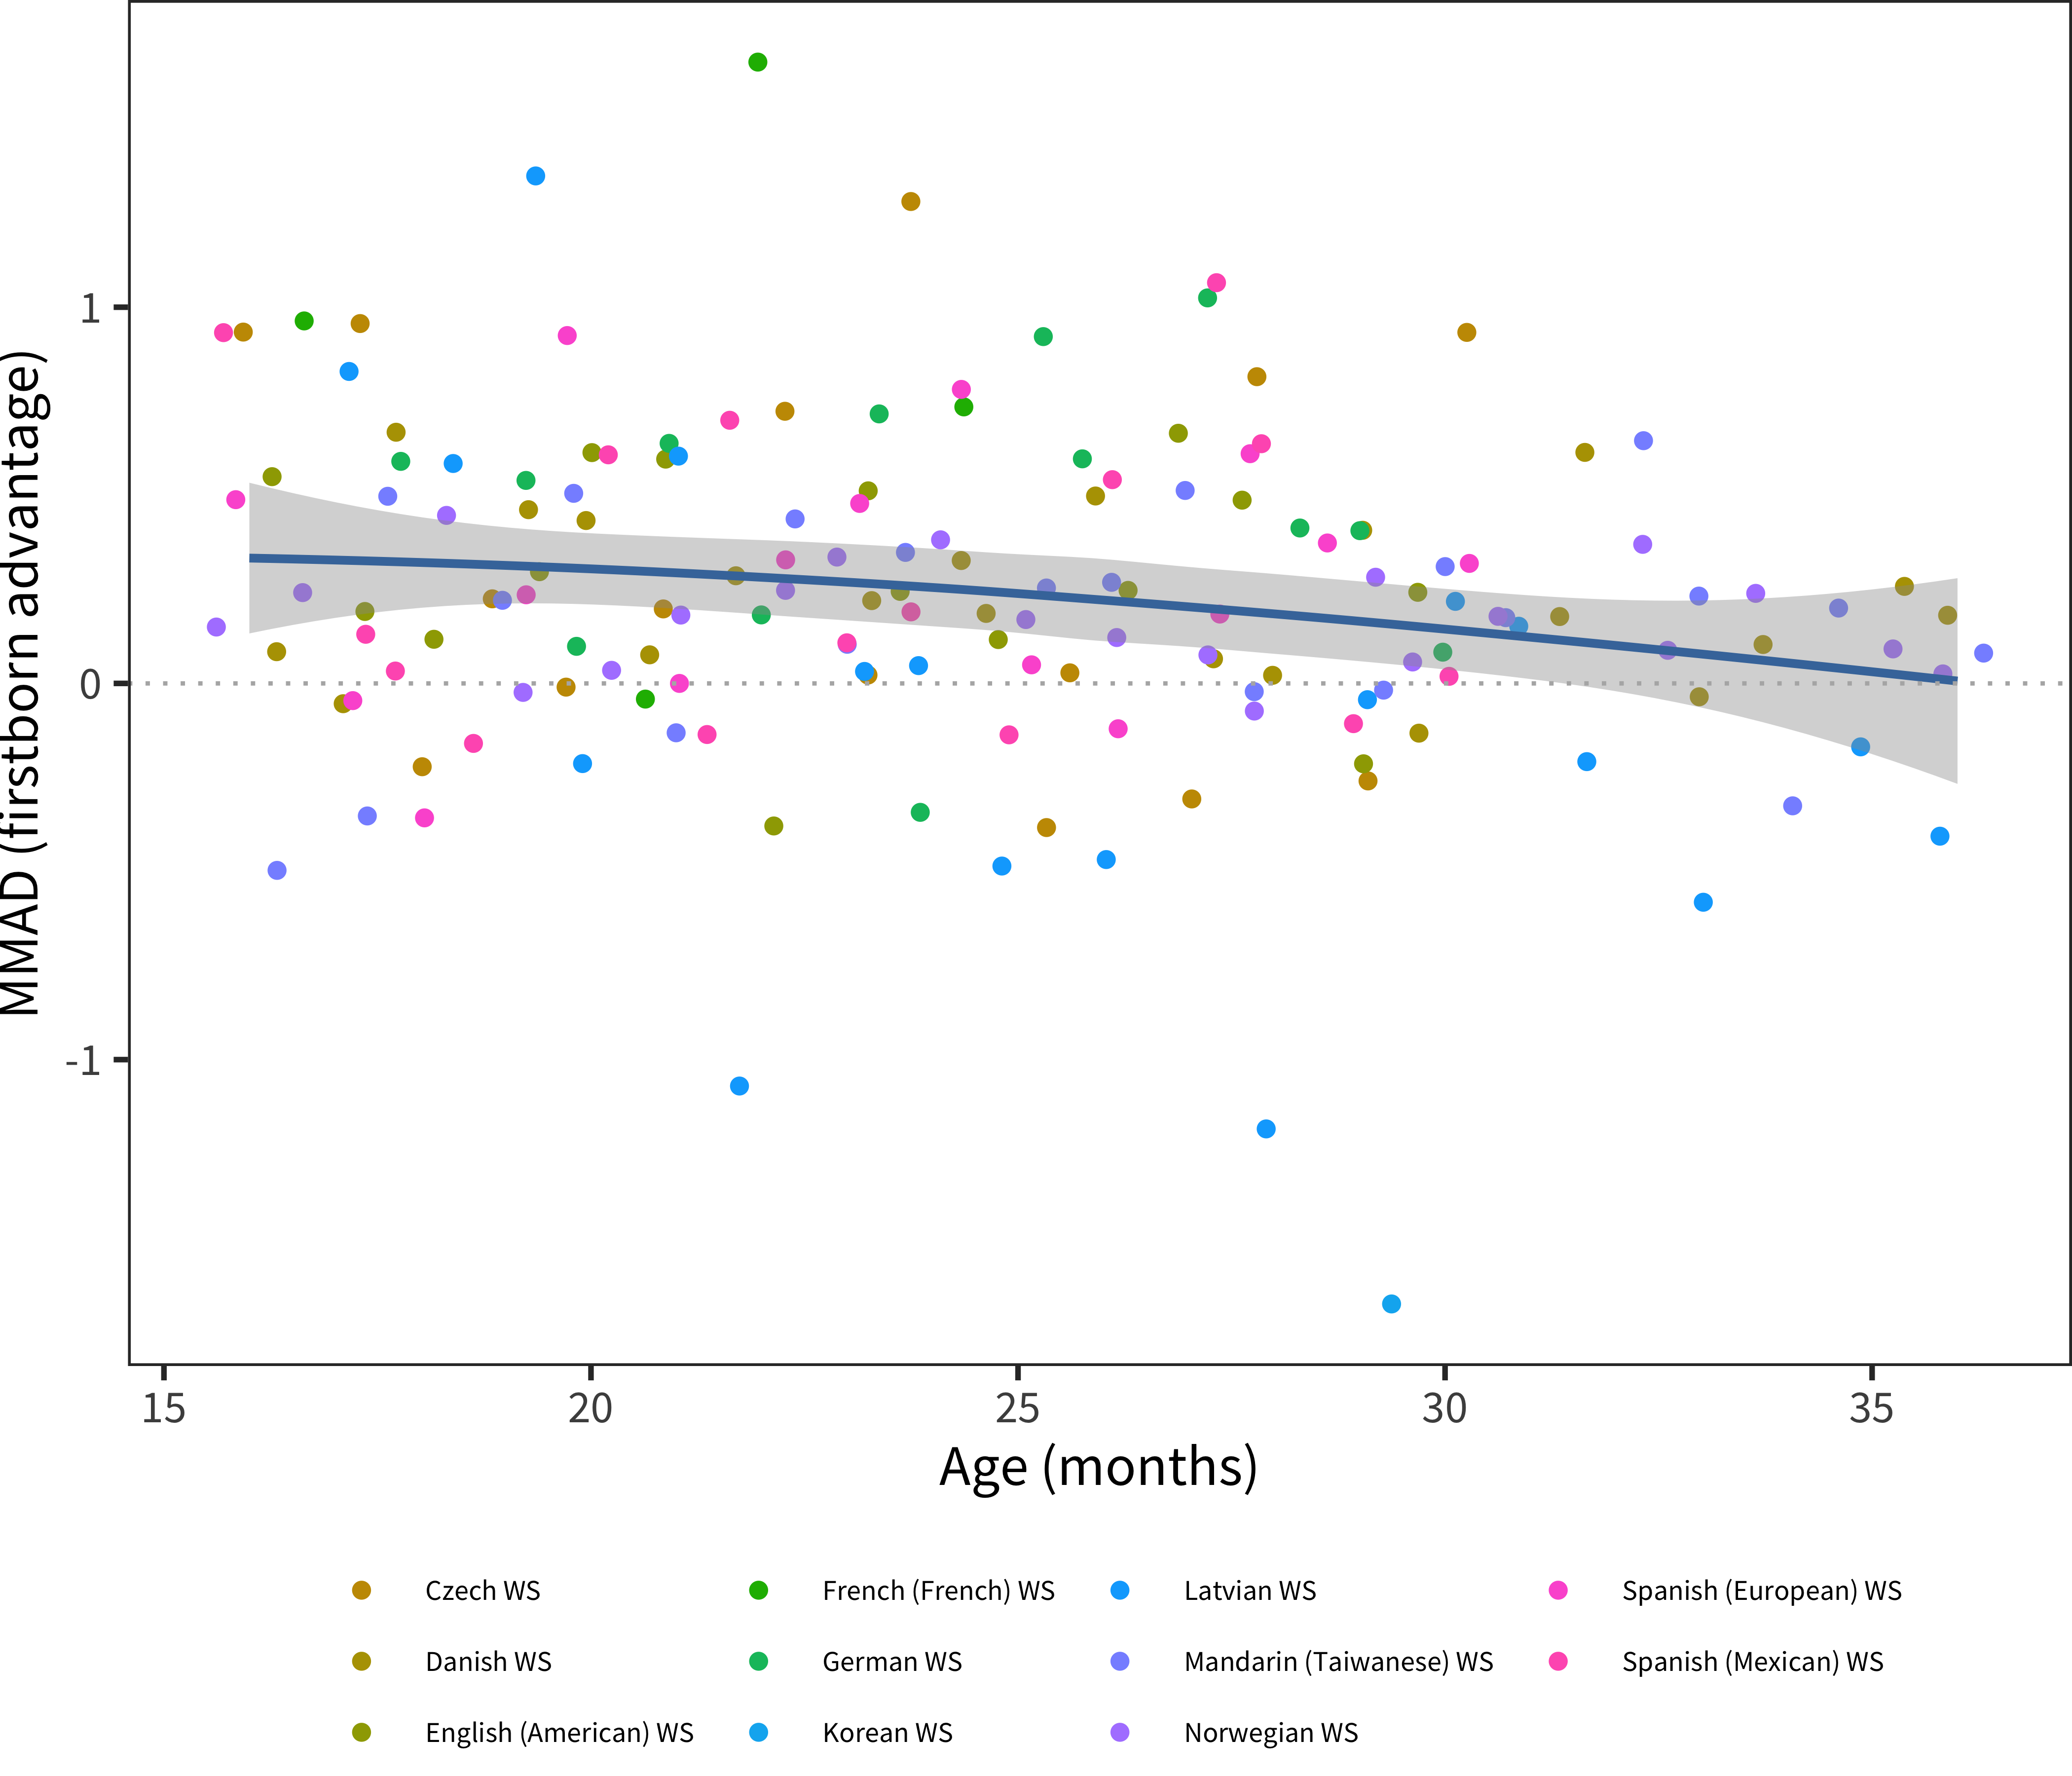
Figure 6.16: MMAD first-born advantage for WS production data in each language across age.
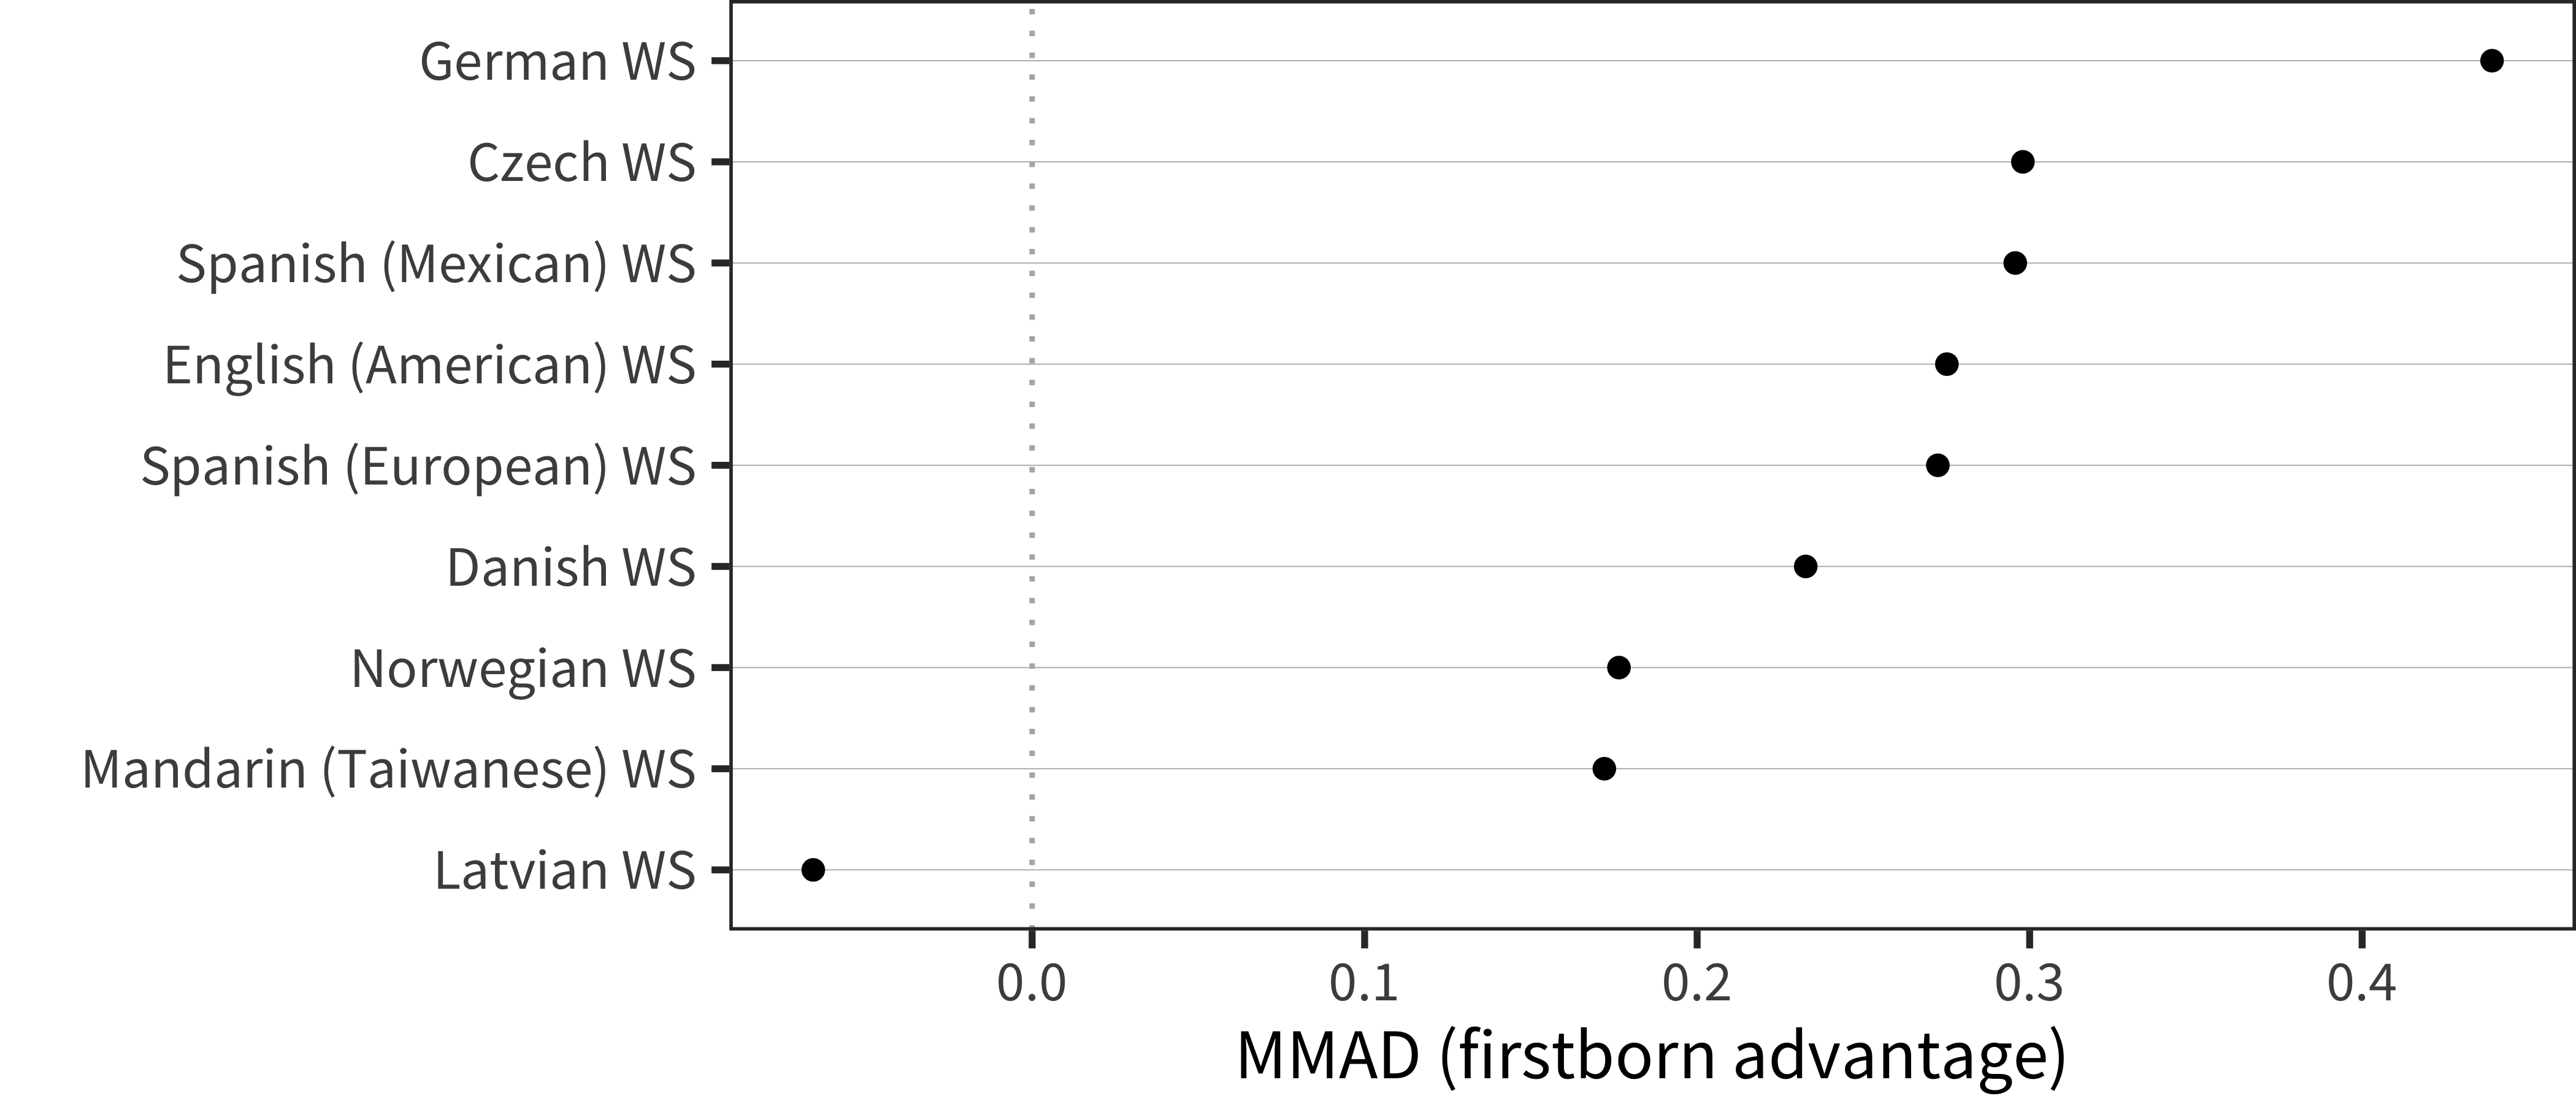
Figure 6.17: MMAD first-born advantage for WS production data in each language averaged over age.
6.2.3 Discussion
Analyzing birth order effects, we see a relatively consistent cross-linguistic pattern: earlier-born children show larger vocabularies in production (though not in comprehension for the most part). This general finding is consistent with previous literature reporting a first-born advantage for individual languages. Our results suggest that the same pattern appears in most languages, with only a few showing different magnitudes. While the current dataset cannot rule out reporting-related reasons for these demographic differences, this explanation does seem unlikely for two reasons (mirroring discussion of sex differences above). First, our results largely mirror non-parent report findings in the literature (Berglund, Eriksson, and Westerlund 2005). Second, reporting bias would be relatively more likely to influence comprehension relative to production vocabulary.
We can only speculate as to the cause of birth-order related differences in early language given our current data. That said, it seems very reasonable to assume that parents speak more to first-born children as the addressee, just because of the pure statistical fact of having a second possible addressee for other utterances (cf. Zajonc and Markus 1975). And although it is certainly possible to learn from overheard speech under optimal conditions (e.g., Akhtar, Jipson, and Callanan 2001; Akhtar 2005), a variety of studies suggest that speech directed to a particular child is the best predictor of that child’s learning outcomes (Weisleder and Fernald 2013; Shneidman and Goldin-Meadow 2012).
6.3 Socioeconomic status
From health to education, children from lower socioeconomic status (SES) backgrounds tend to be at higher risk for a variety of negative developmental outcomes, compared to their higher-SES peers (Bradley and Corwyn 2002). A large literature documents specific relations between SES and children’s early language abilities, especially oral vocabulary, which is in turn related to outcomes when children begin formal education (e.g., Hart and Risley 1995; Hoff 2003; Fernald, Marchman, and Weisleder 2013). The parent report method allows the assessment of the influence of SES on vocabulary outcomes earlier in development than is possible with direct assessments. Using the CDI Words & Sentences form, Arriaga et al. (1998) compared the language skills in 103 very low-income toddlers with a sample of middle-income toddlers from the Fenson et al. (2007) norming sample, matched on age and sex. They found that the vocabulary production scores for the low-income group were consistently about 30% lower than those for the middle-income group. The size of these effects suggest that differences in SES are evident from the very earliest phases of language development.
Environmental explanations of these SES effects are often given in terms of indirect factors that affect life opportunities or experiences, such as nutrition and access to health care, as well as more direct factors that impact daily life, such as smoking during pregnancy, or access to quality child care. One well-studied factor is the quality of the interactions that caregivers spend in interactions with their young children, with studies showing that talk from caregivers mediates the effects of SES on child outcomes (e.g., Weisleder and Fernald 2013; Hoff 2003). Alternatively, even early language shows a significant genetic component, raising the possibility that SES-vocabulary links may instead be genetically mediated (Hayiou-Thomas, Dale, and Plomin 2012). That is, parents of higher-SES backgrounds may use language more extensively and at a higher level due to their genetic endowment, which is then passed on to their children. Some initial DNA-based evidence for a genetic component to the SES-language link is provided by Trzaskowski et al. (2014).
In the current dataset, we use maternal education as a proxy for SES, following previous work suggesting that maternal education is strongly related to SES variation, particularly early in development (Bornstein et al. 2003; Hoff 2003). The presence of this variable gives us the opportunity to explore the extent of SES effects on vocabulary across several language communities, albeit using an imperfect proxy measure. While different language communities may differ in their distributions along the SES gradient, cross-language comparisons may nevertheless shed light on the factors that lead to relations between SES and children’s vocabulary outcomes. On the one hand, relatively constant relations across language communities that vary widely in indirect and direct factors that shape learning would provide prima facie support for genetic explanations. In contrast, a greater degree of cross-language variability would point to the origins of SES effects in aspects of children’s early environments that vary with SES to differing degrees across countries (e.g., L. C. Fernald et al. 2012).
6.3.1 Comprehension (WG)
We again perform the same set of analyses, shown in Figure 6.18, Figure 6.19, Figure 6.20, and Figure 6.21.
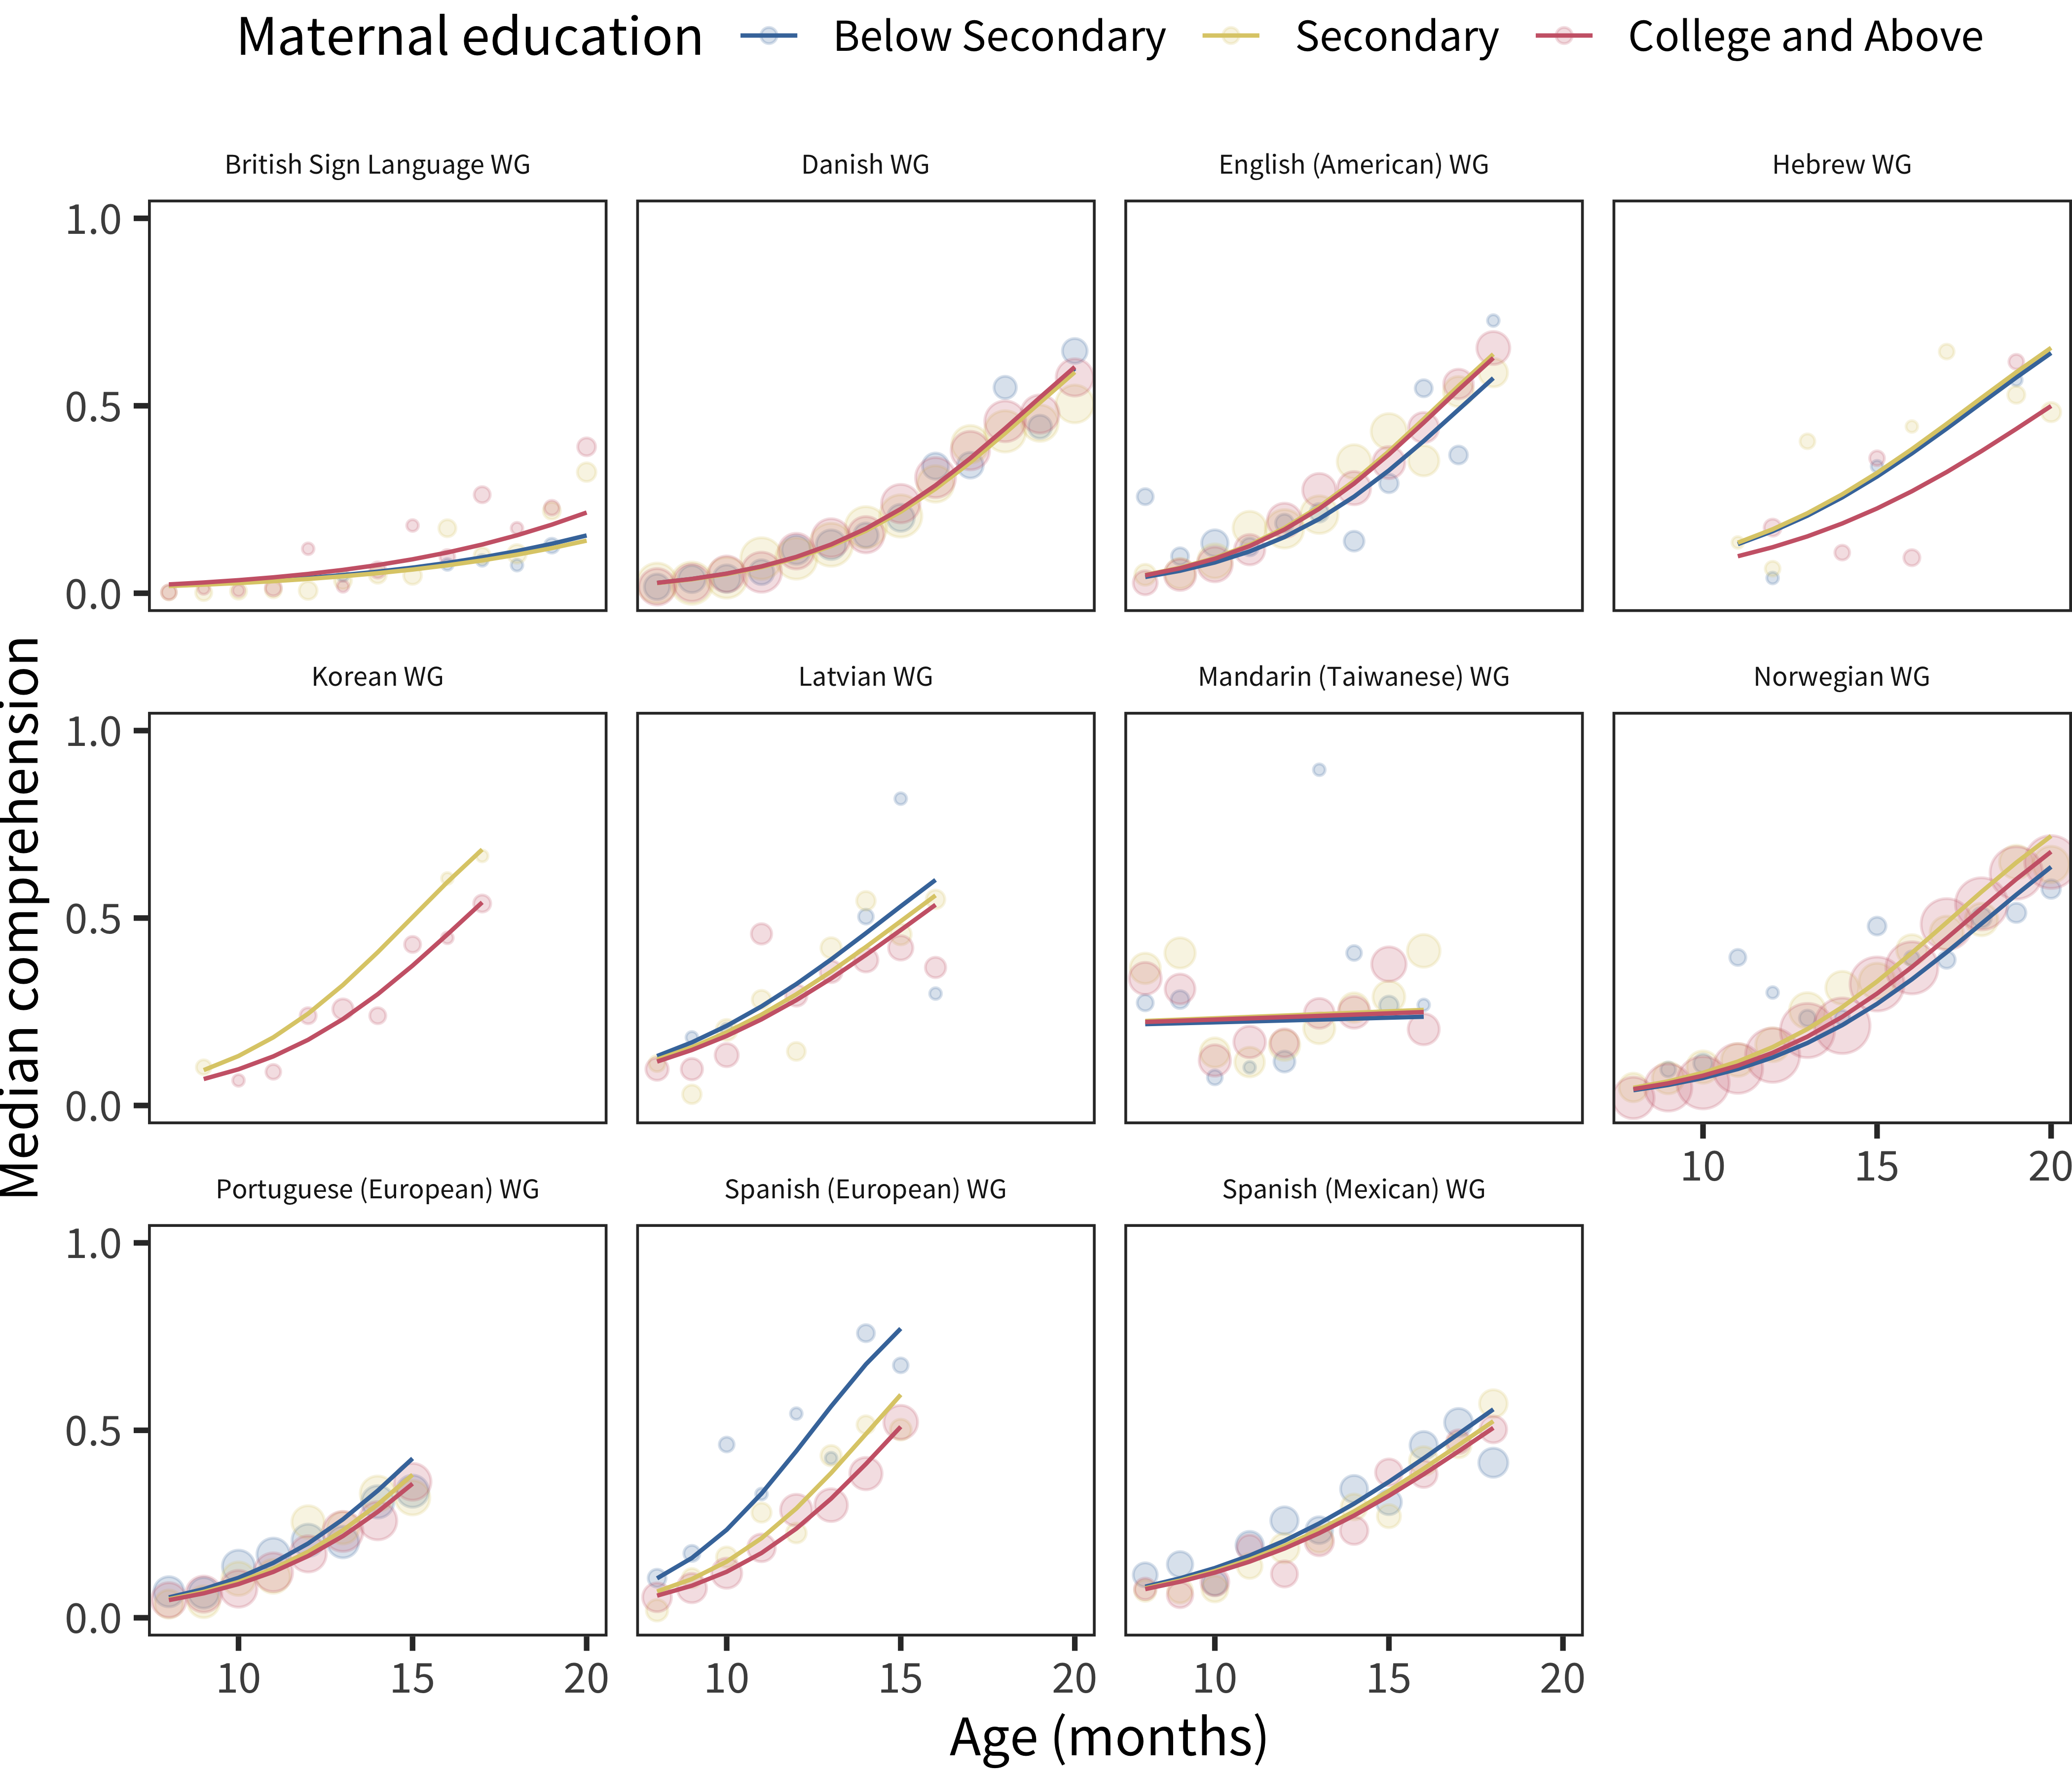
Figure 6.18: Differences in WG comprehension scores by maternal education, plotted across age by language.
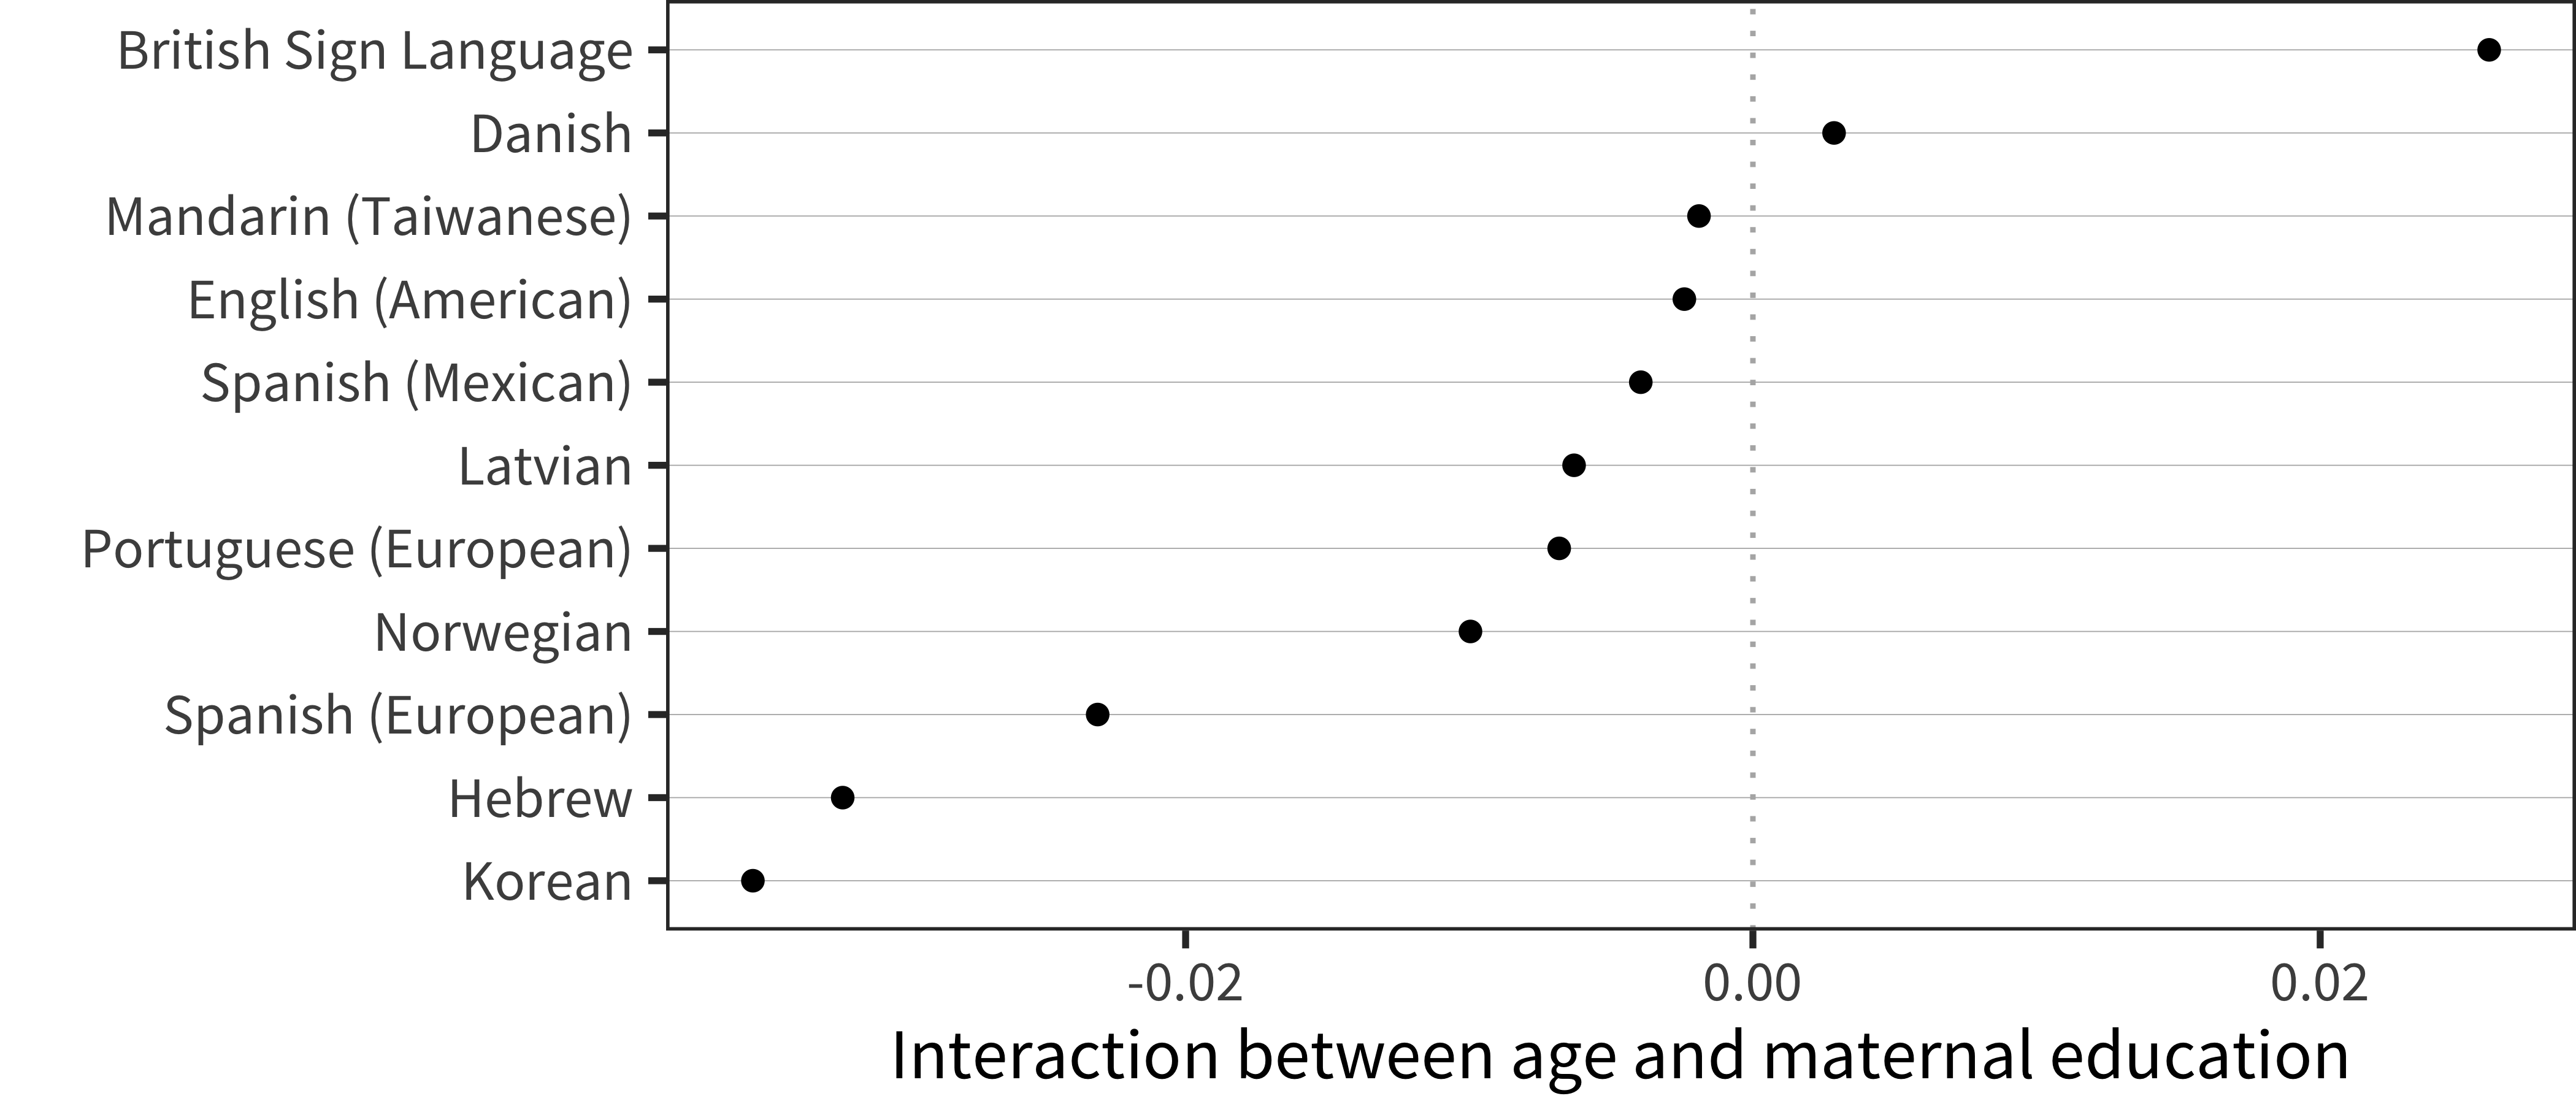
Figure 6.19: Interaction term between age and maternal education for WG comprehension data in each language.
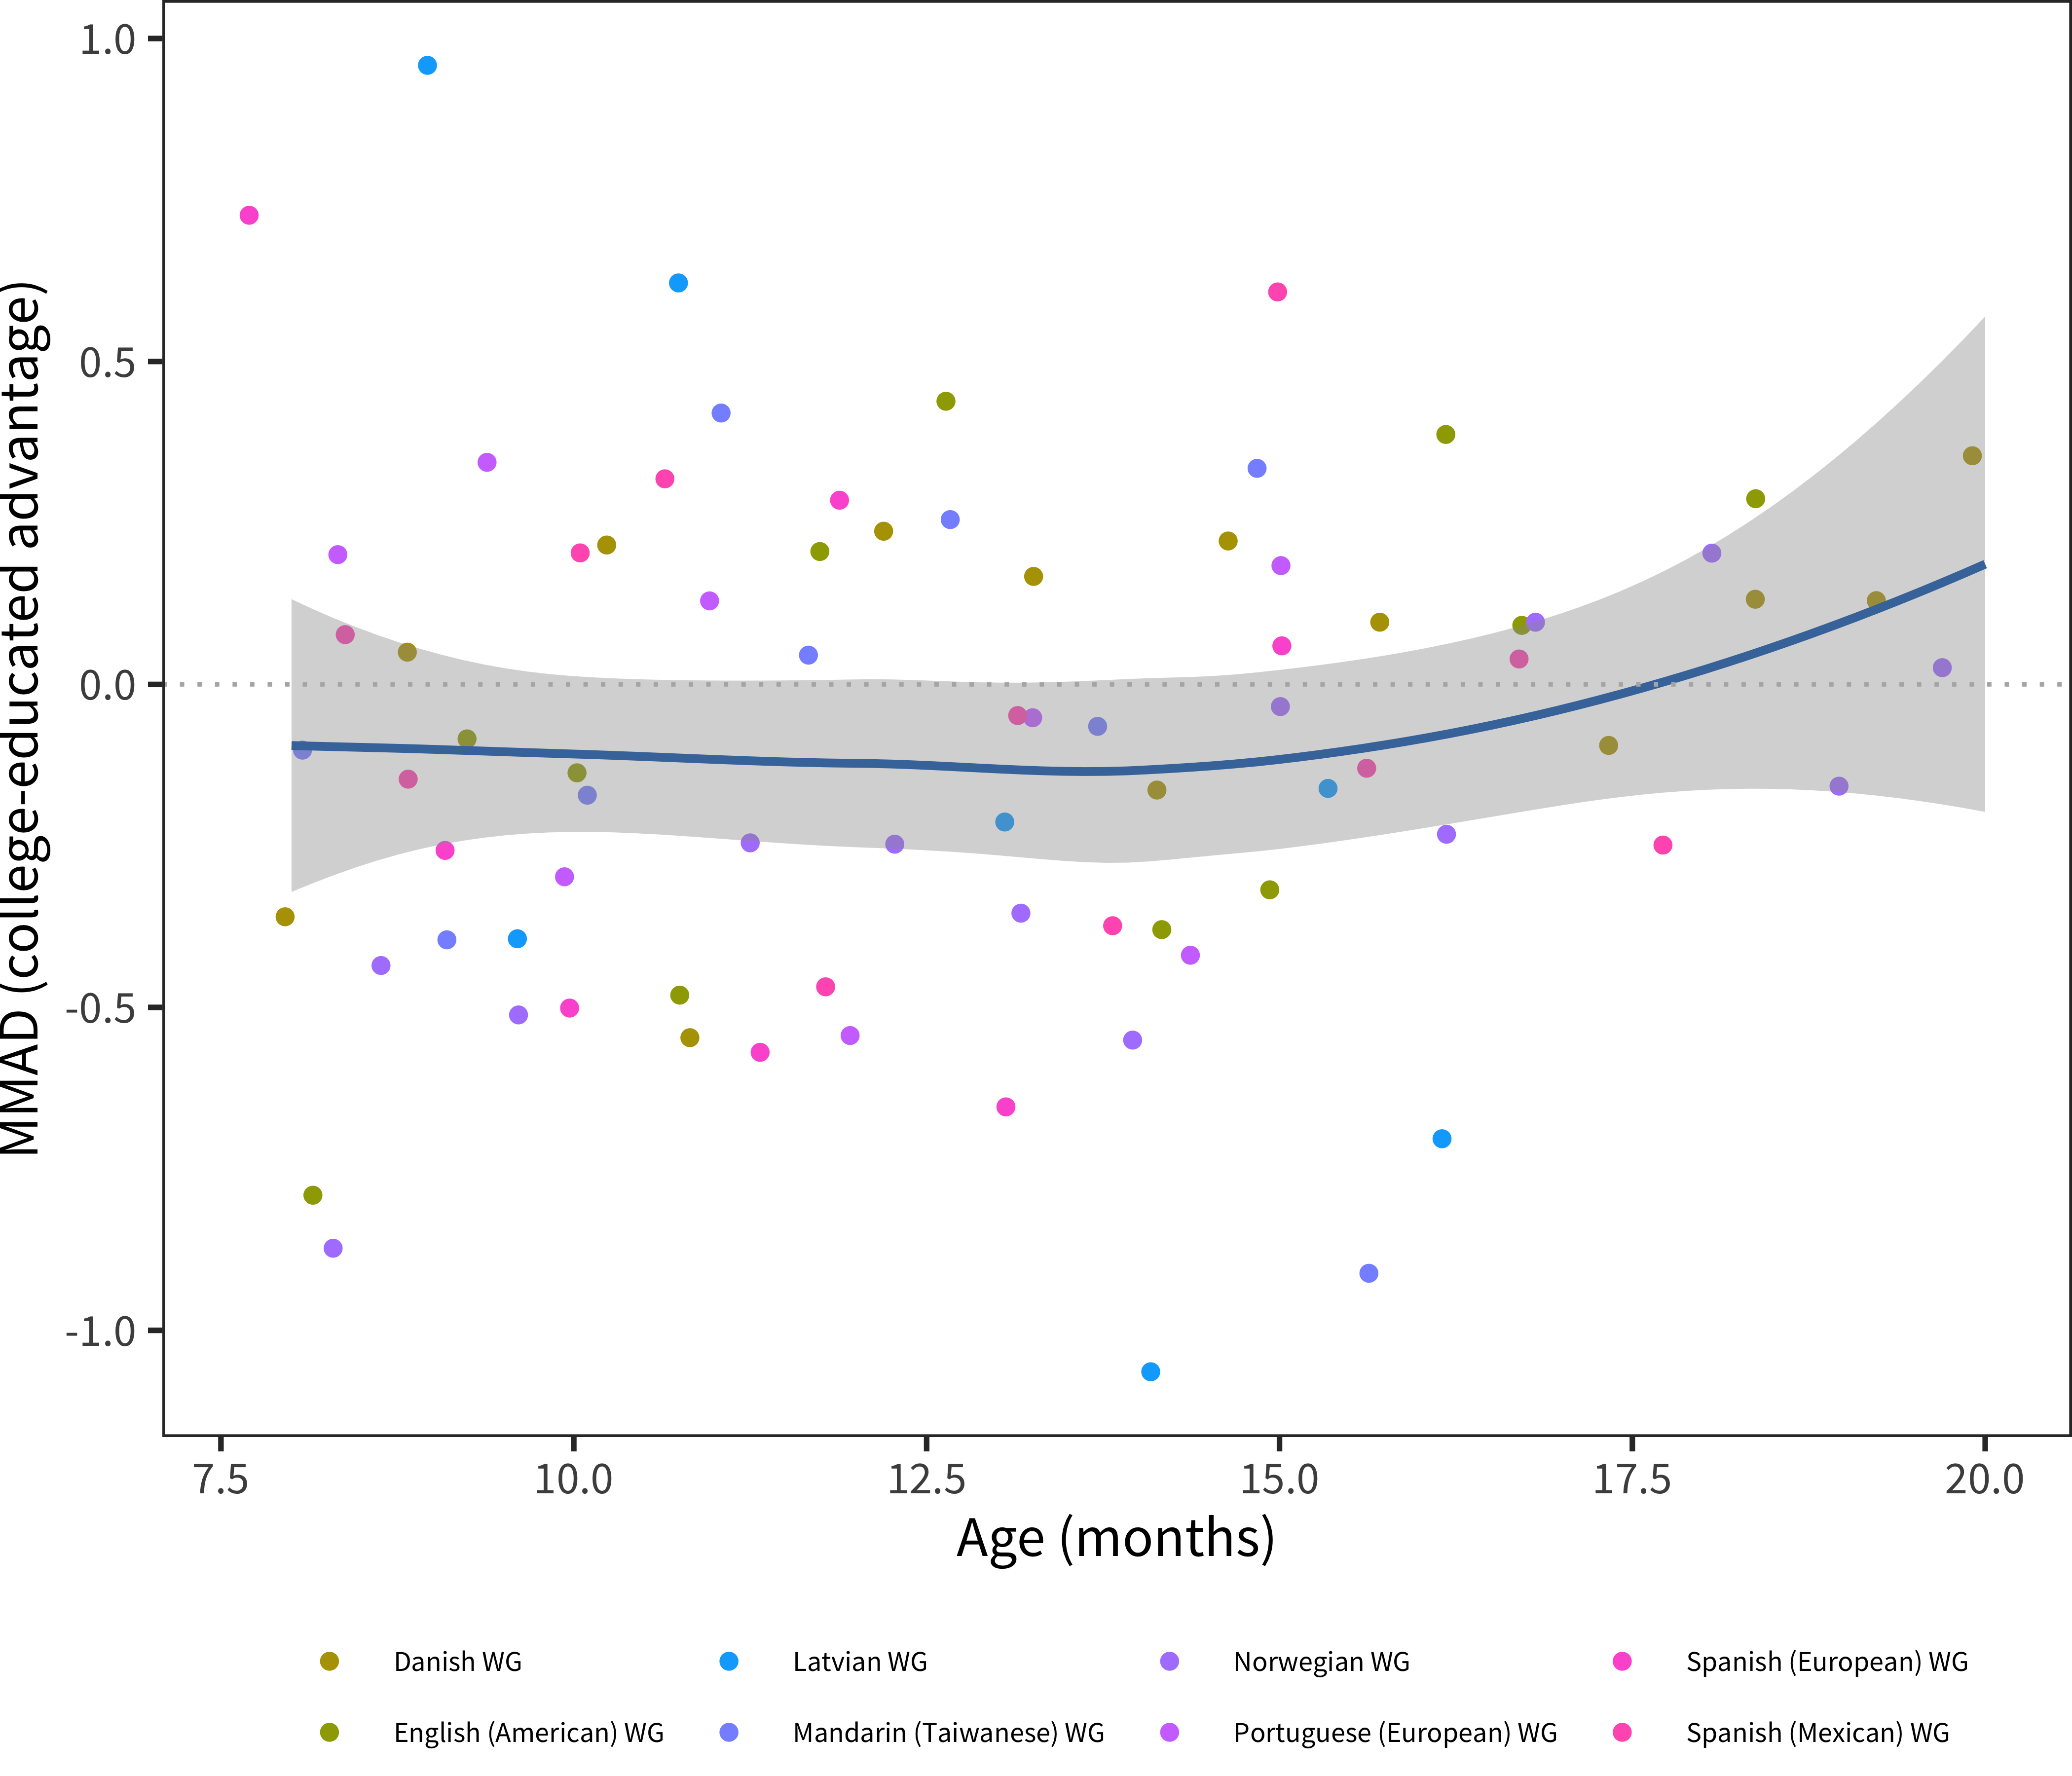
Figure 6.20: MMAD college-educated advantage for WG comprehension data in each language across age.
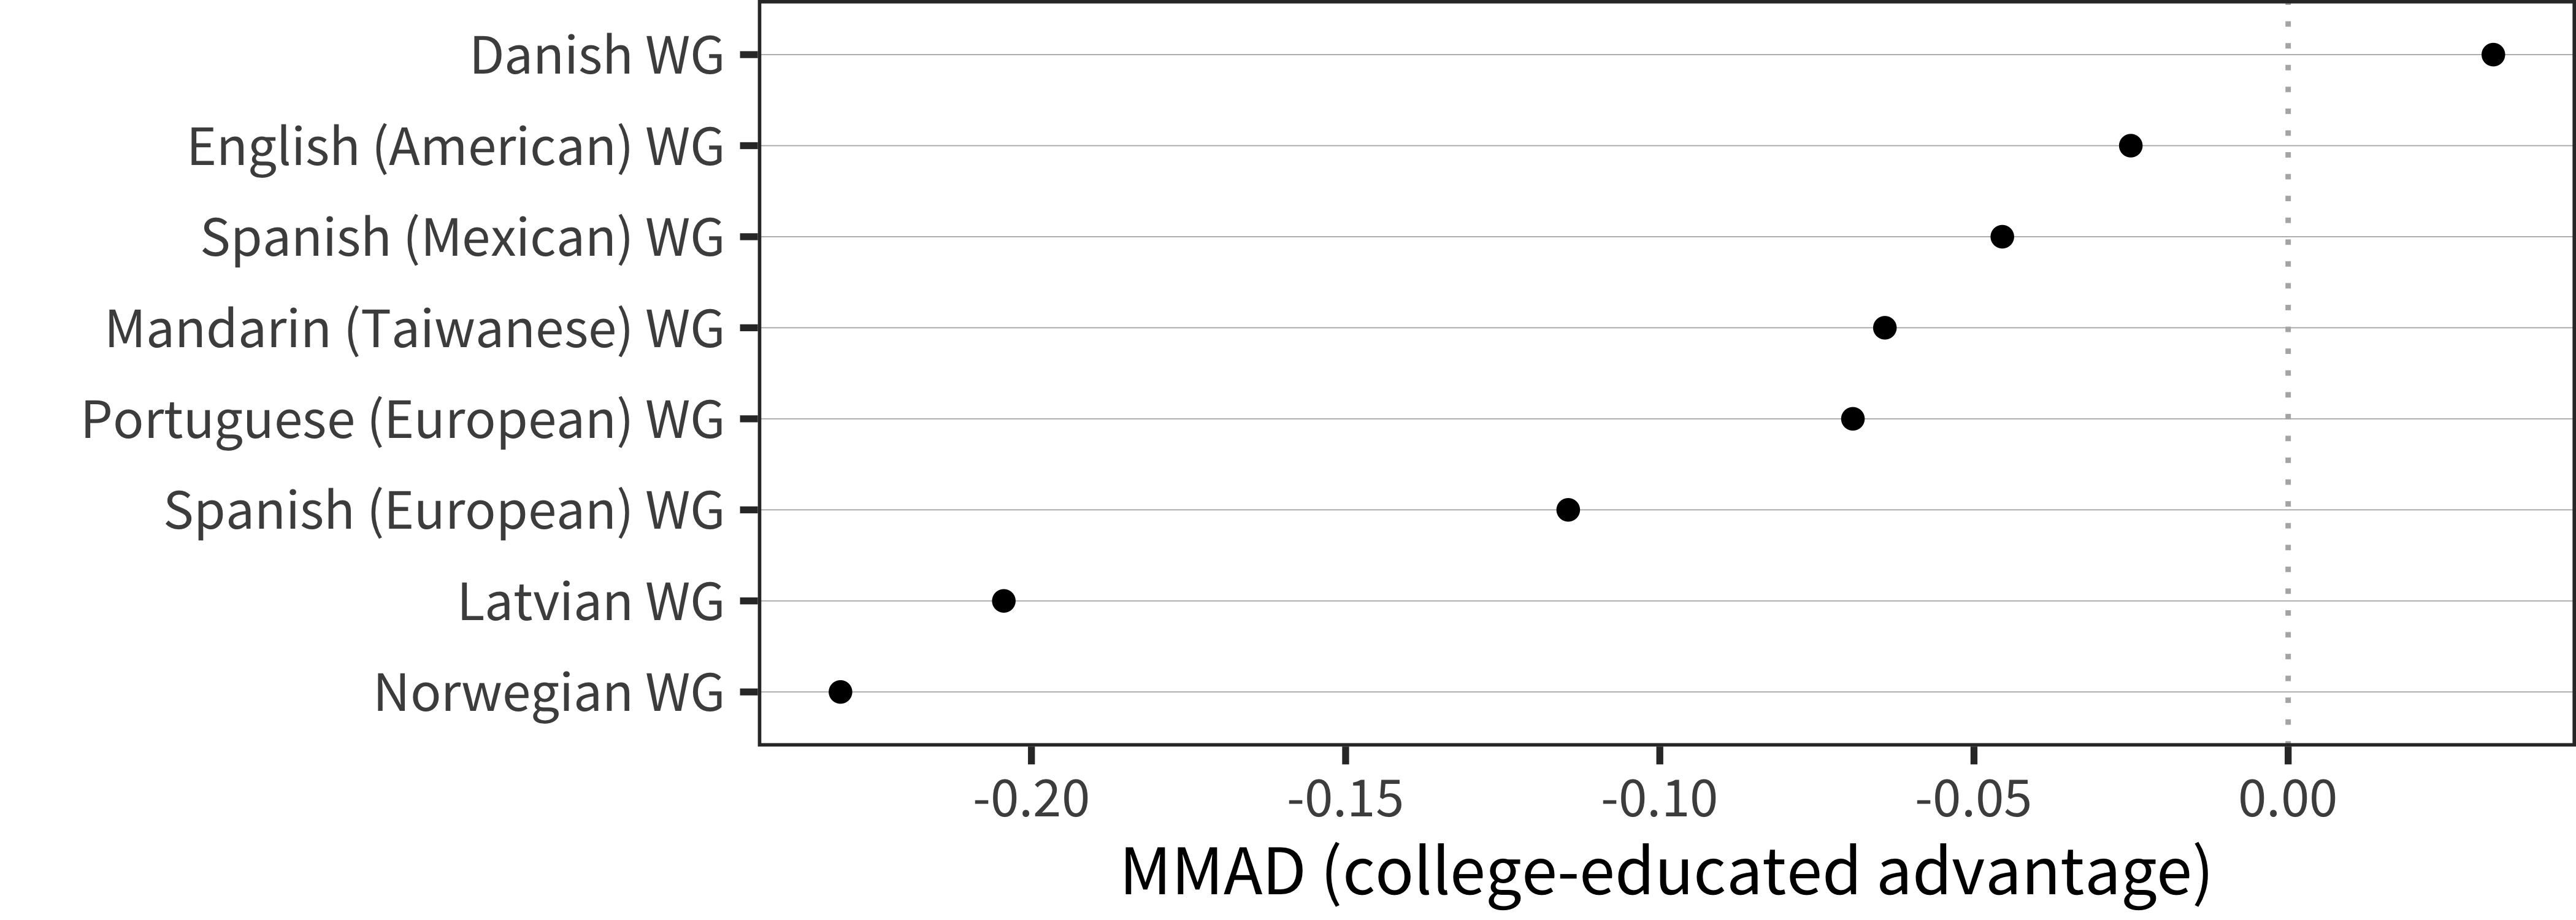
Figure 6.21: MMAD college-educated advantage for WG comprehension data in each language averaged over age.
These results suggest a small – and perhaps negative – relationship between maternal education and early comprehension vocabulary. We discuss this result below.
6.3.2 Production (WS)
The next analyses are shown in Figure 6.22, Figure 6.23, Figure 6.24, and Figure 6.25.
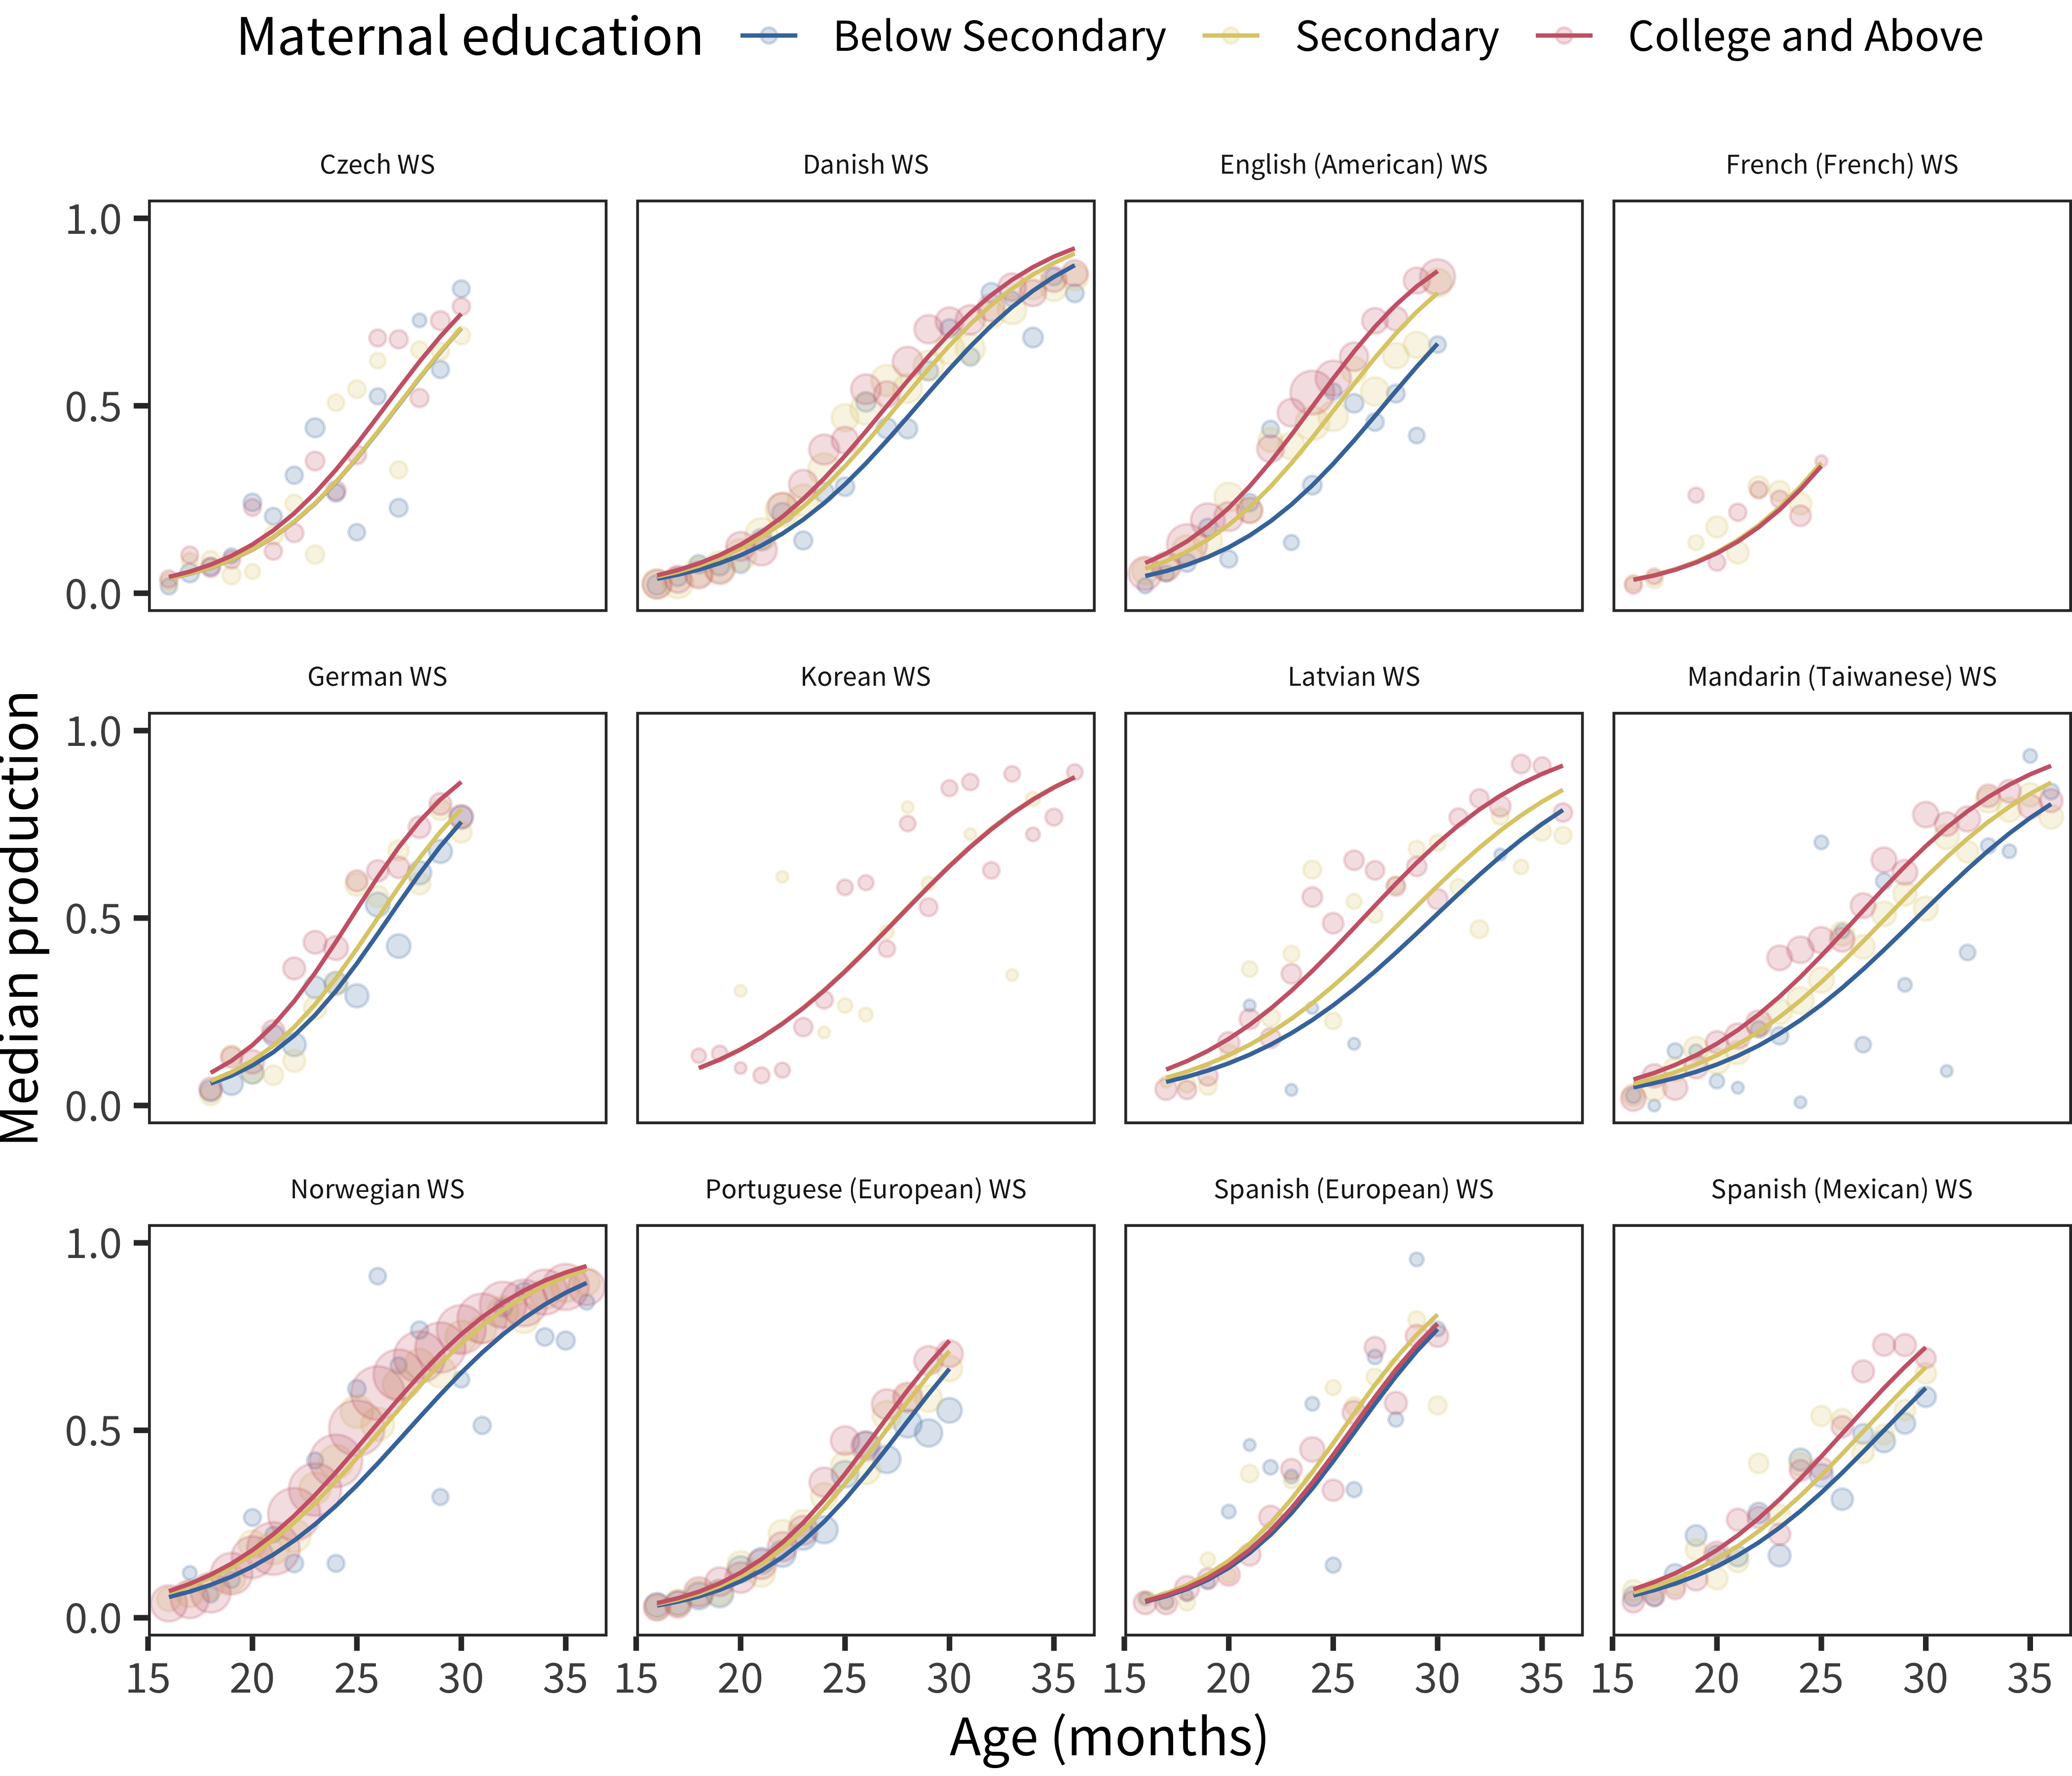
Figure 6.22: Differences in WS production scores by maternal education, plotted across age by language.
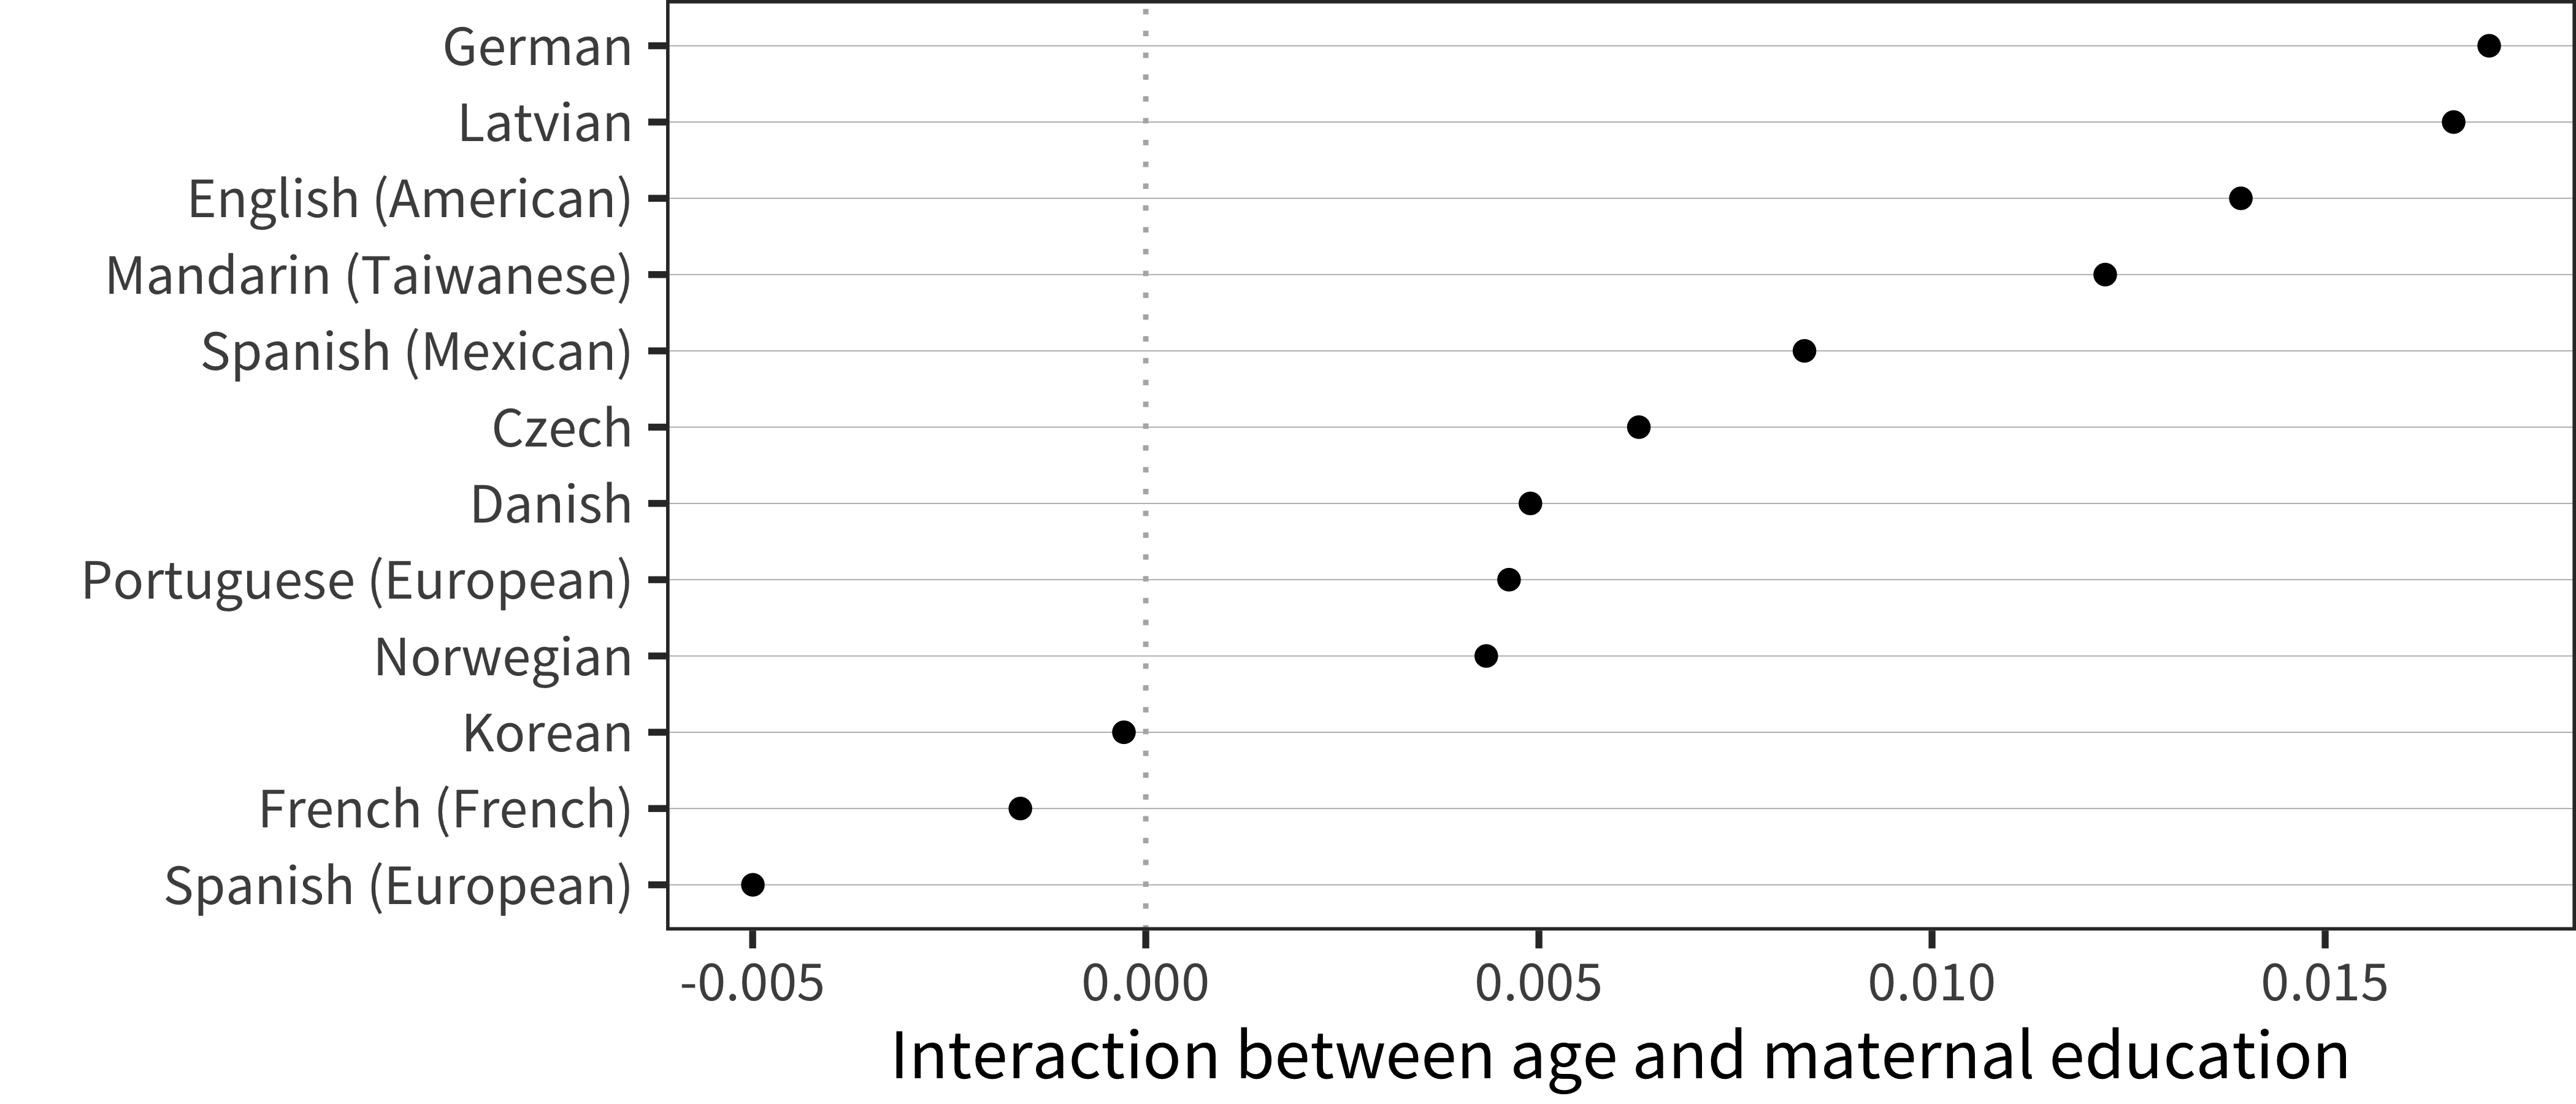
Figure 6.23: Interaction term between age and maternal education for WS production data in each language.
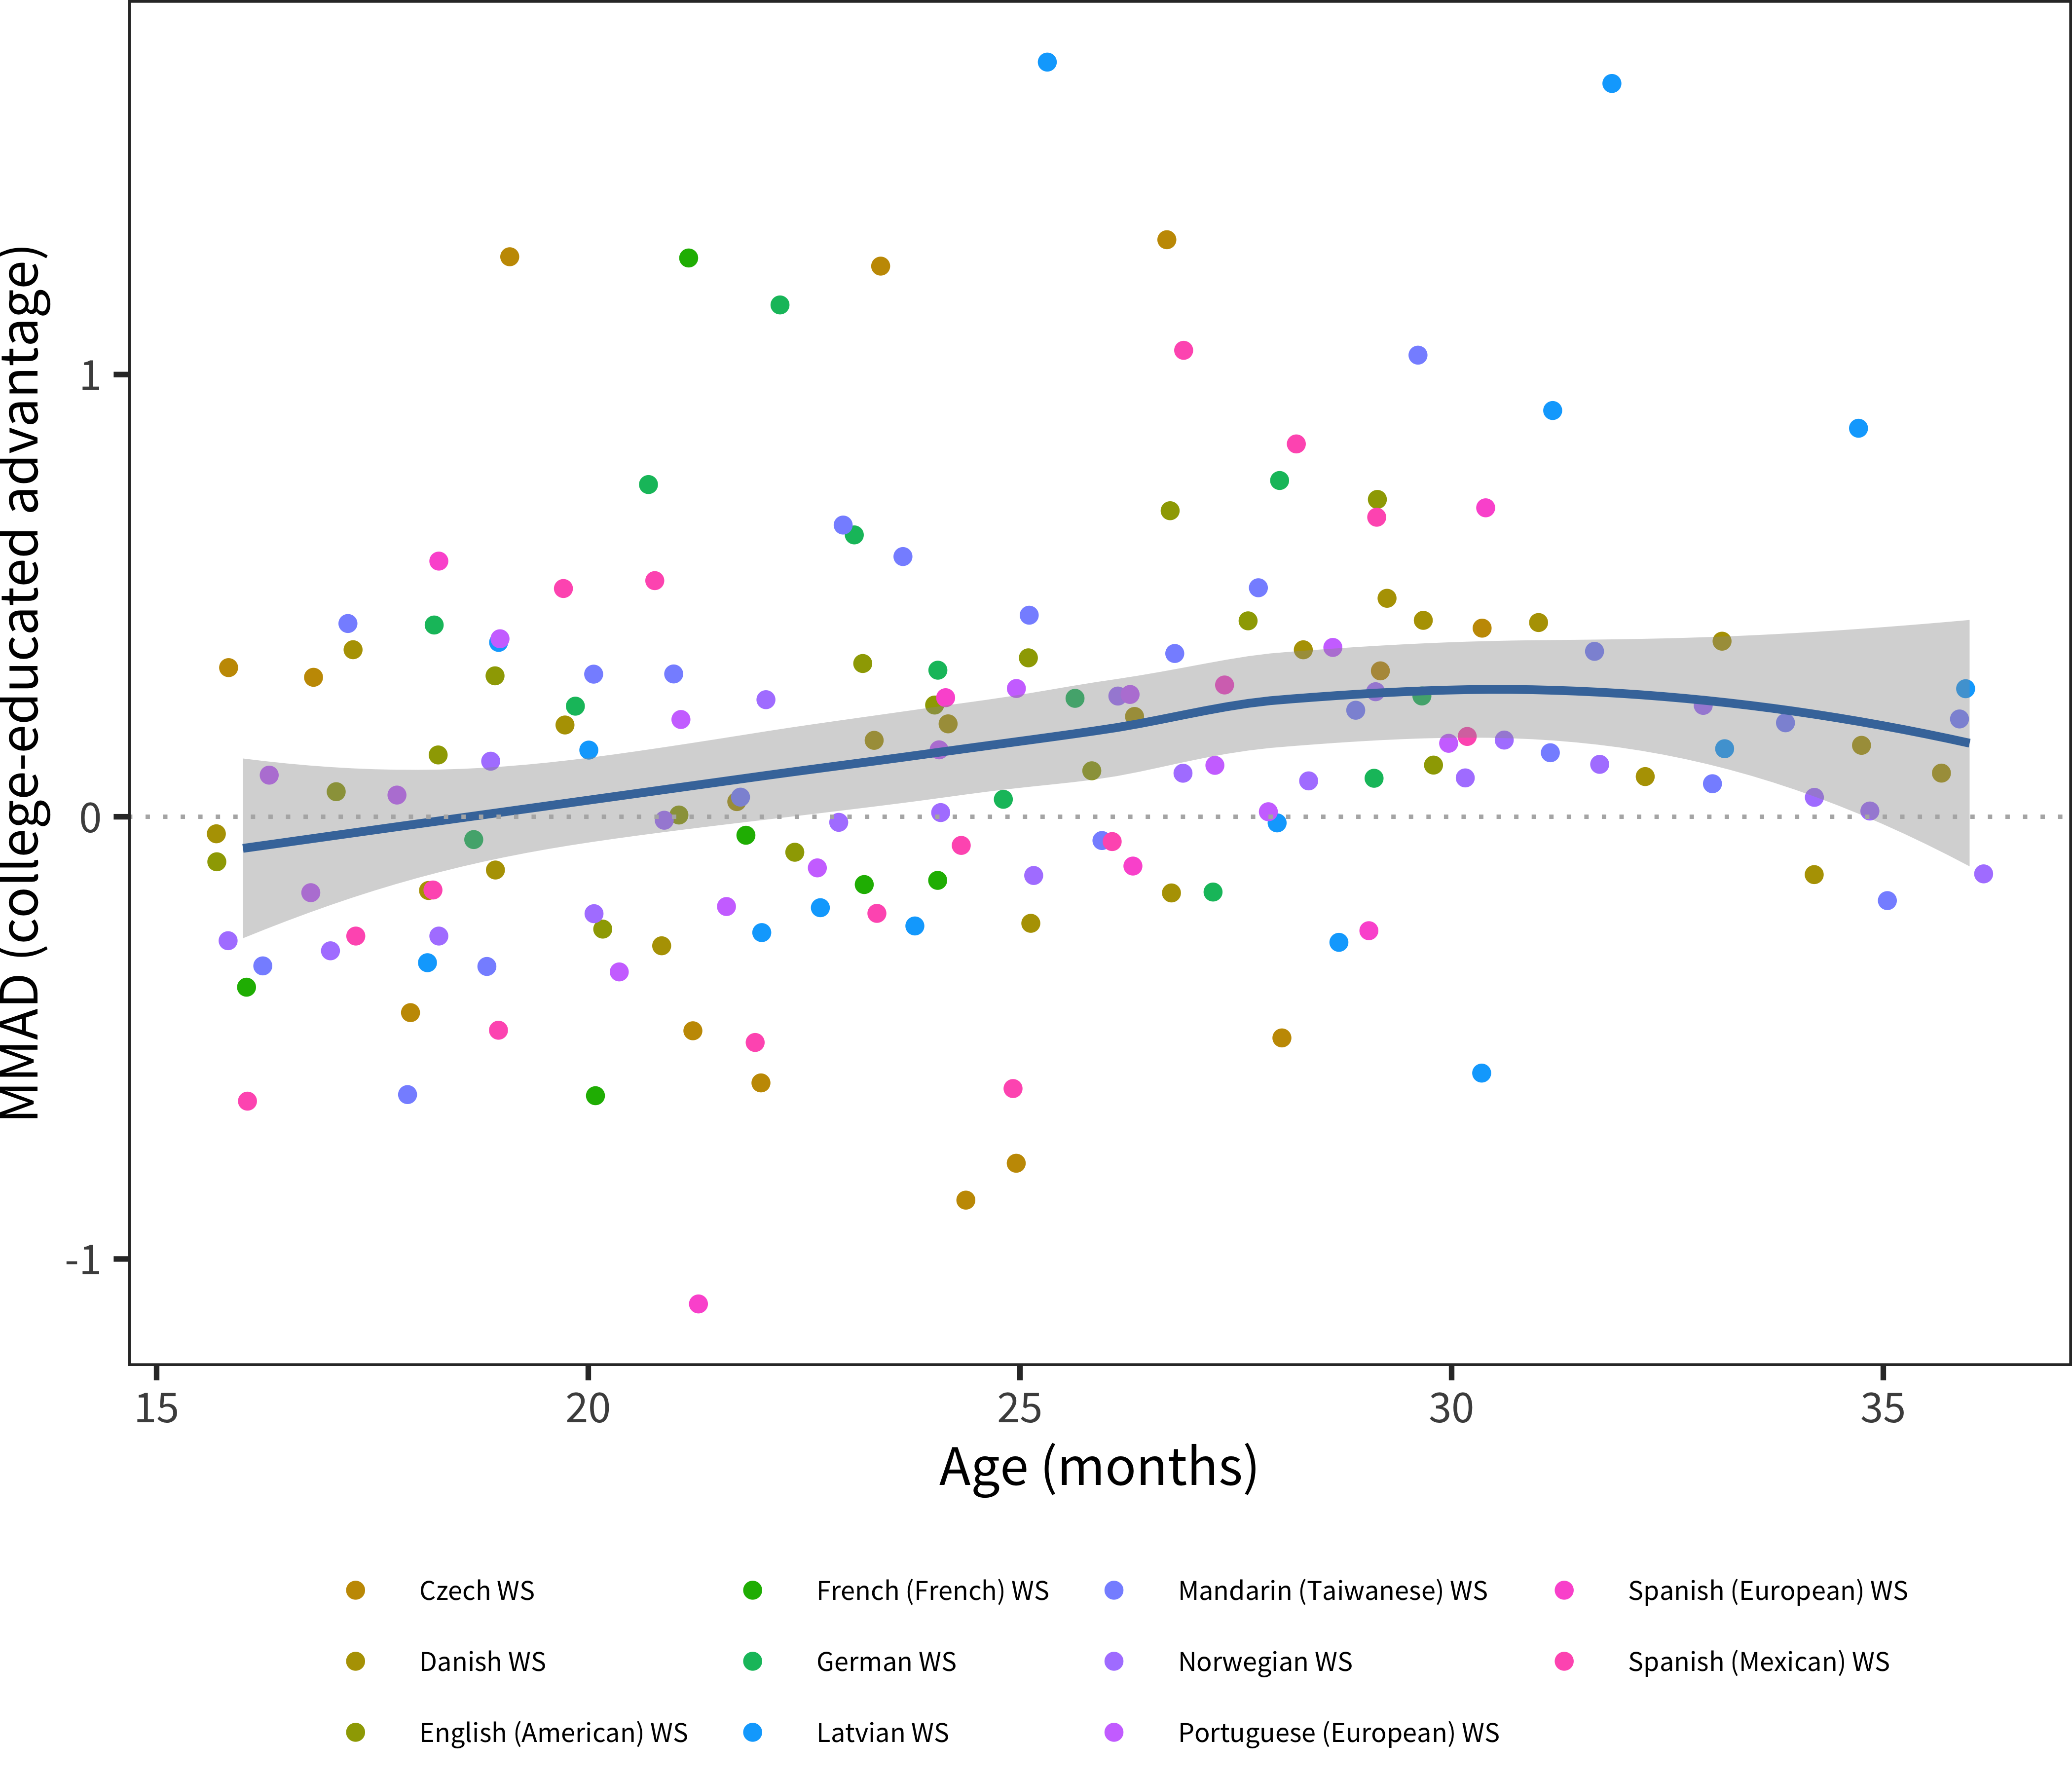
Figure 6.24: MMAD college-educated advantage for WS production data in each language across age.
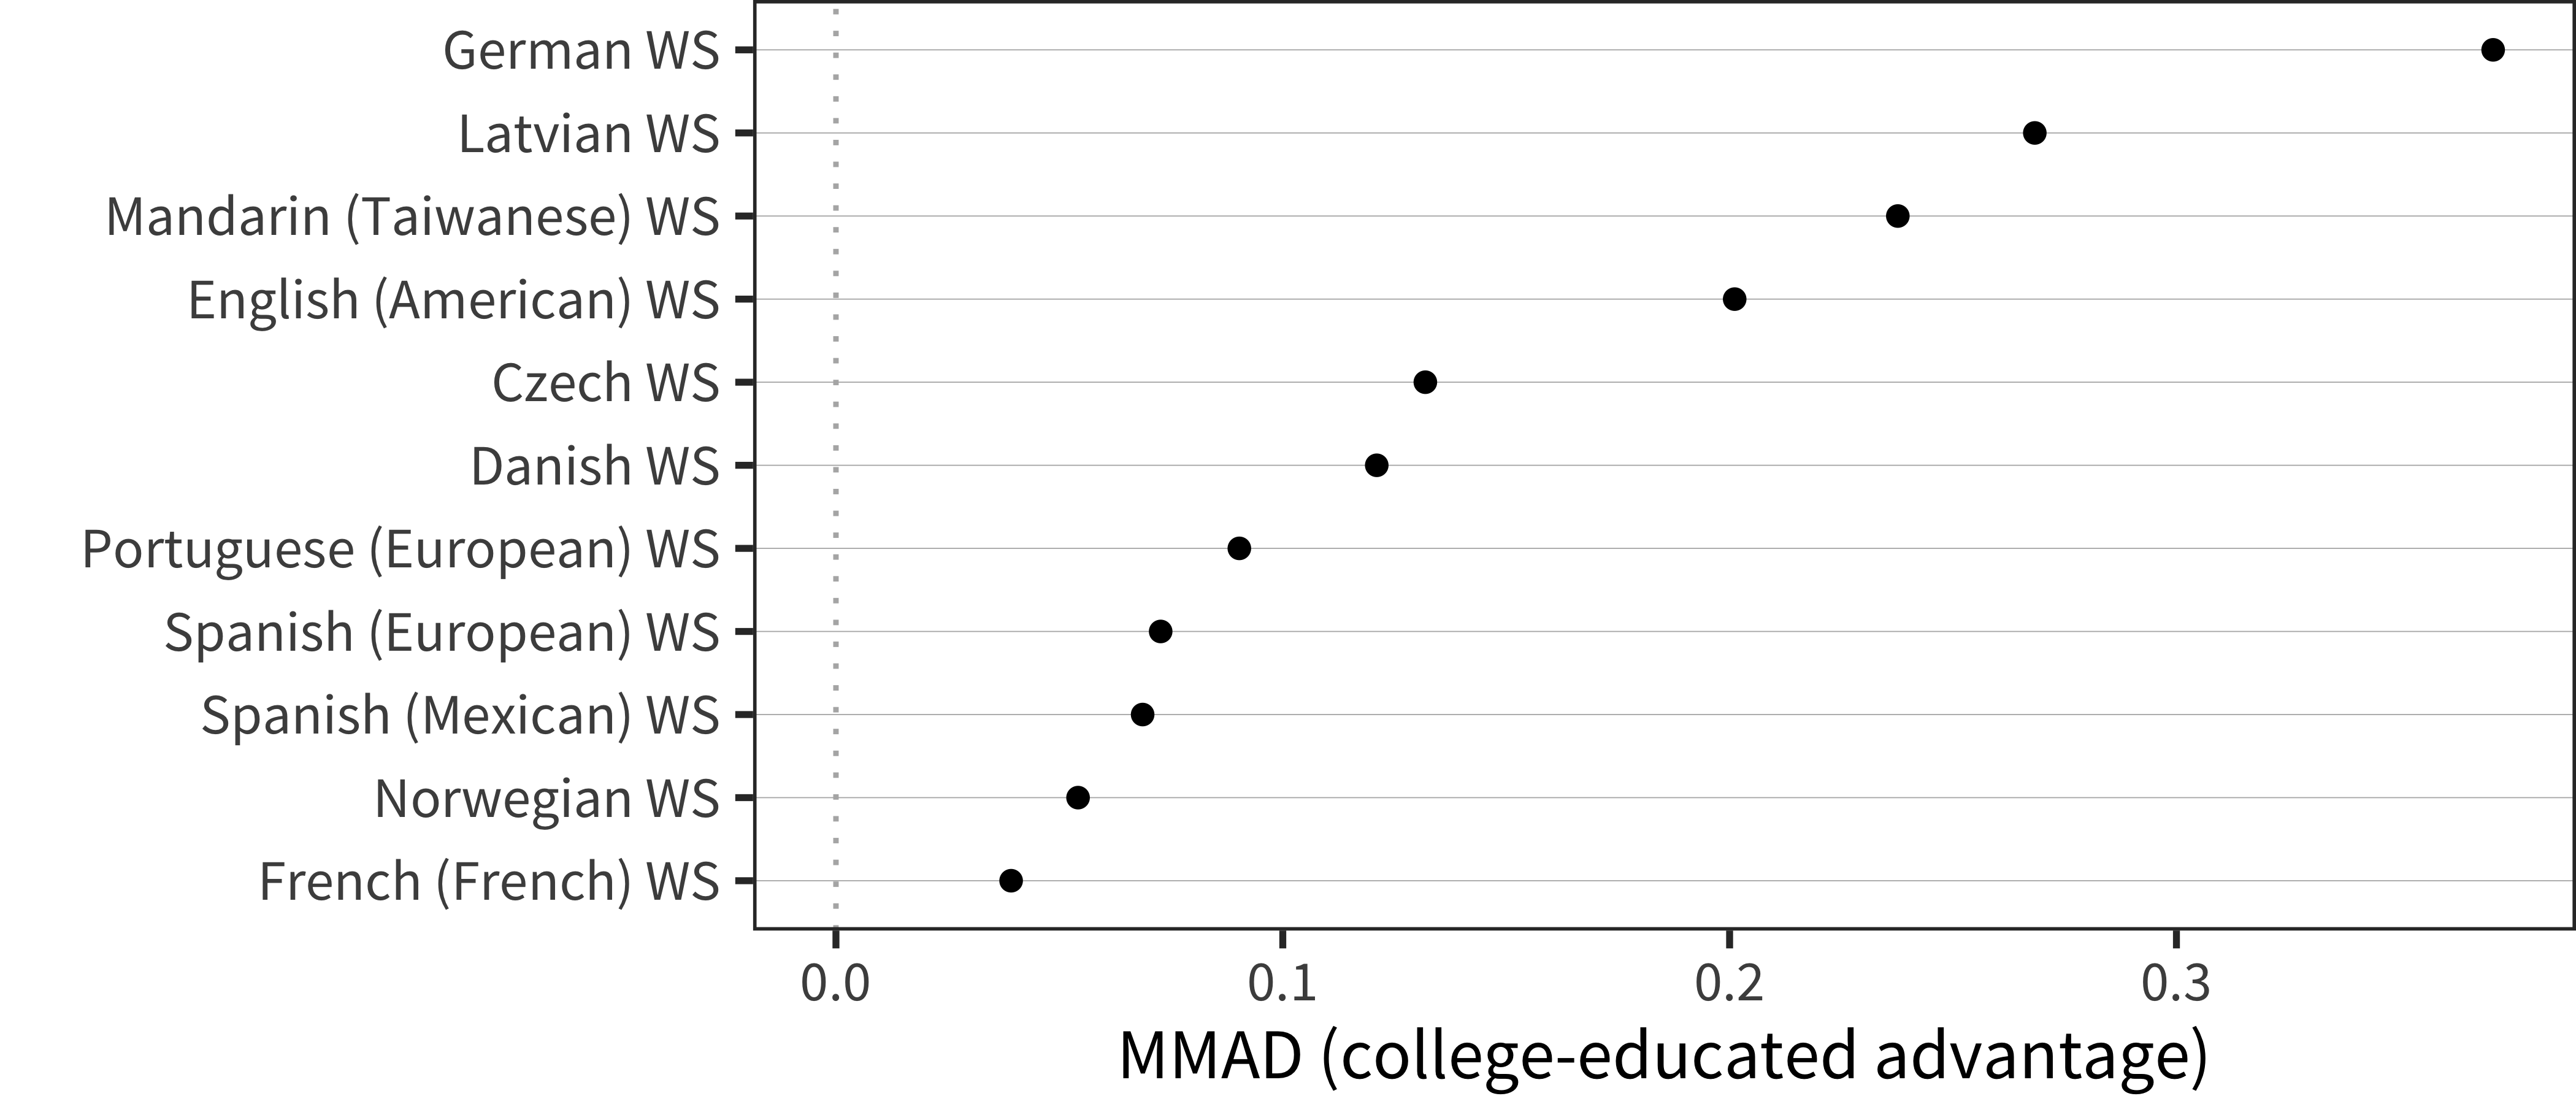
Figure 6.25: MMAD college-educated advantage for WS production data in each language averaged over age.
In contrast to the comprehension results, there were robust positive maternal education differences in nearly every dataset we examined, though the magnitude varied across datasets.
6.3.3 Discussion
The relationship between maternal education and children’s vocabulary is variable across countries in our data, but we did observe some kind of college advantage for production in nearly every dataset that we examined. The observational nature of our data precludes strong inferences about the precise factors that lead to these differences. Speculatively, the magnitude of the differences across countries suggests a role for environmental factors in shaping variation in child outcomes even before the age of 3 years, although of course genetic and other biological factors may also play a role.
While lower scores on the vocabulary checklists can reflect authentic differences across children from different SES groups, it is also possible that some SES effects are the result of differential reporting biases (for discussion, see Fenson et al. 2007). The direction of such effects is unknown, however; it is not a given that low SES parents would under-report their children’s language. For example, in Feldman et al. (2000)’s study of more than 2000 children, vocabulary comprehension scores on the Words & Gestures form were higher for caregivers with lower education than for caregivers with higher education, whereas, the opposite relation was found for vocabulary production and later grammar skills from the Words & Sentences form. In that study, parents with low educational and income levels seemed to overestimate their child’s comprehension abilities. Over-reporting of comprehension by low-SES parents could account for the different effects of maternal education that we observed in comprehension compared with production – on this view, we should put most stock in the production results.
Based on these findings and apparent failures of administration for comprehension (e.g., the Taiwanese Mandarin WG form; see Chapter 3, difficult data), we suspect that comprehension measures – while reliable when used appropriately – are nonetheless more vulnerable to bias. In order to report on comprehension, parents have to separate evidence of comprehension of a word in isolation from evidence for comprehension in highly-constrained contexts where the child can “do the right thing” without truly understanding the linguistic content. In addition, some parents may recall times when the words were used in the child’s presence and may confuse exposure with understanding. These difficulties may explain why parental reports of verbal comprehensionare sometimes higher than results of direct testing (Tomasello and Mervis 1994; Bergelson and Swingley 2015) and why correlations between parental reports and comprehension scores from other methods are low for very young children (Goldfield and Reznick 1990; Bergelson and Swingley 2015).
6.4 Discussion
In this chapter, we quantified the relationships between vocabulary and sex, birth order, and maternal education. Although all of these have some potential to be influenced by reporting bias, in all cases we see some reasons from prior literature to suspect that similar effects are present (at least in English) for non-parent report measures. The one likely exception is in the case of maternal education, where comprehension reports may be a less reliable signal of SES-related differences due to differences in the interpretation of the comprehension measure. With respect to production measures, in contrast, we see no reason to discount CDI-based measurements.
The relationships we observed were more prominent in every case for production than comprehension. This prominence could be a function of the relatively greater psychometric reliability of production compared with comprehension (see Chapter 4), the reporting bias issue (at least in the case of SES). It could also reflect demographic differences increasing over developmental time, since the production measures we examined are largely from older children than the comprehension. (We did not include early production in our analyses as we found that the data were noisy and hard to interpret due to children’s small production vocabularies for much of the measured range).
We could only speculate about the origins of the relations we found, but the directionality of these relations was similar across languages and they showed reasonable consistency across the full language sample (especially for sex differences). For sex differences, this consistency leads us to speculate about the cognitive origins of verbal ability differences, which are found quite consistently outside of the CDI as well (e.g., Maccoby and Jacklin 1974). In contrast, birth order and maternal education-related differences were slightly more variable than sex differences and have been argued in previous work to relate to children’s input. We return to the interpretation of demographic differences in vocabulary in Chapter 17.
Throughout, we will assume that parents report on children’s assigned sex at birth, rather than their gender identity. In the absence of any data that would tease apart the biological, psychological, and social aspects of sex and gender, we use interchangeably the terms sex/gender, female/girl, and male/boy.↩︎
As an illustrative example, some literature has implicated fetal testosterone in sex differences in verbal ability. Lutchmaya, Baron-Cohen, and Raggatt (2001) used CDI measures and recovered an effect somewhat similar to ours with a small sample (d = 0.64 at 18 months with N = 87), and d = 0.60 at 24 months for a subsample). They found some relationship with fetal testosterone across sexes, but it did not hold up within sex (perhaps due to small samples). The mechanism by which testosterone translates into vocabulary growth is unclear however.↩︎
An earlier version of this analysis was reported in M. C. Frank et al. (2016).↩︎
These data are not error-free; we have double-digitized one point.↩︎